Informer Basics
Informer Support Links
- Advanced Filters
- Why Datasets vs AdHoc Report
- Informer Mapping Document (csv)
- Informer Mapping Document (pdf)
Datasets vs Ad Hoc Reports
The big difference between Ad Hoc Report and Datasets are that the data in a Dataset is persisted, whereas the data in an Ad Hoc Report is temporary. The reason this is important is that a single dataset could drive multiple users Charts and exports, whereas an Ad Hoc Report would need to be run for each user. This means hitting the database and waiting for the query behind the Ad Hoc report to run.
Datasets also bring a number of other benefits.
- Single source of truth - A single dataset can provide data to multiple charts and exports for many users, thus making sure all users are seeing the same data.
- Less stress on the database - Given that the data in a Dataset is persisted. The dataset can be scheduled to reload one or more times a day and then reports will access this data instead of running each time a report is requested.
- Stored Visuals - You can create common visuals and store them on the Dataset. This allows end users to quickly see the data in the dataset visualized.
- Stored Filters - You can store common filters making it easy for users to filter the data with a single click.
- Comparison boards and Dashboards - Datasets are needed to be able to create and use Comparison boards and Dashboards
Creating a Dataset from an Ad Hoc Report
A dataset and an Ad-Hoc report have many of the same features, however the dataset is the preferred format if you plan on scheduling the query to run at certain intervals and what multiple users to be able to use reports built from the dataset.
For example, if you had 10 users who needed the data from a query and it was built as an Ad-Hoc report, the database would be hit 10 times to produce the data. Once for each user running the report.
However, if the query was build as a Dataset and was scheduled to be reloaded every 6 hours, then those 10 users could access the data with just a single run of the query against the DB every 6 hours.
This is a change from Informer 4, so you will see that all of the base reports and imported reports come into Informer 5 as Ad-Hoc reports. Luckily, it is very easy to convert these Ad-Hoc reports into Datasets.
Step 1
Find the report you want to covert to a Dataset, open it and run it.
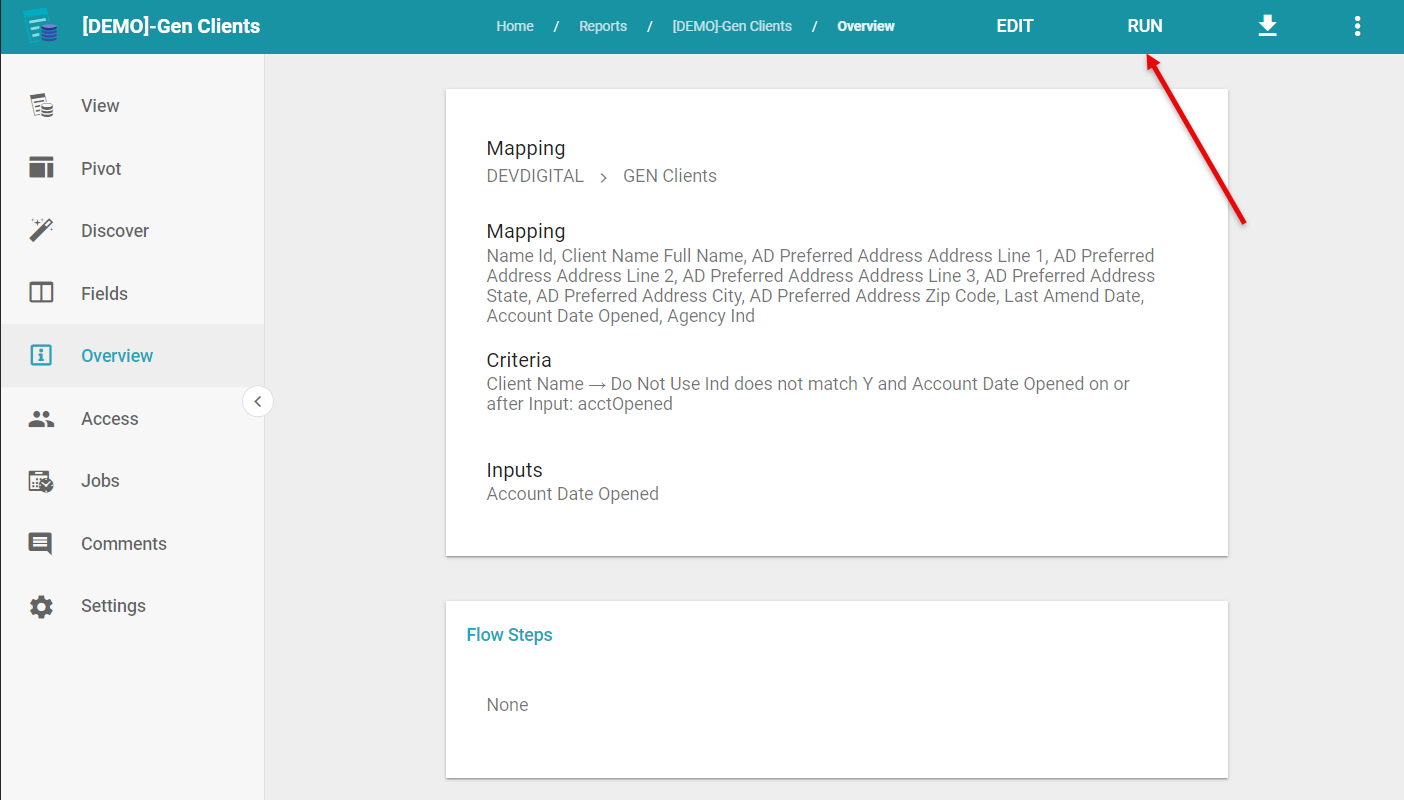
This is very important, as the report must have data in it for you to get the "Create Dataset" option.
Step 2
Click on the vertical 3 dots in the right corner and choose "Create Dataset"
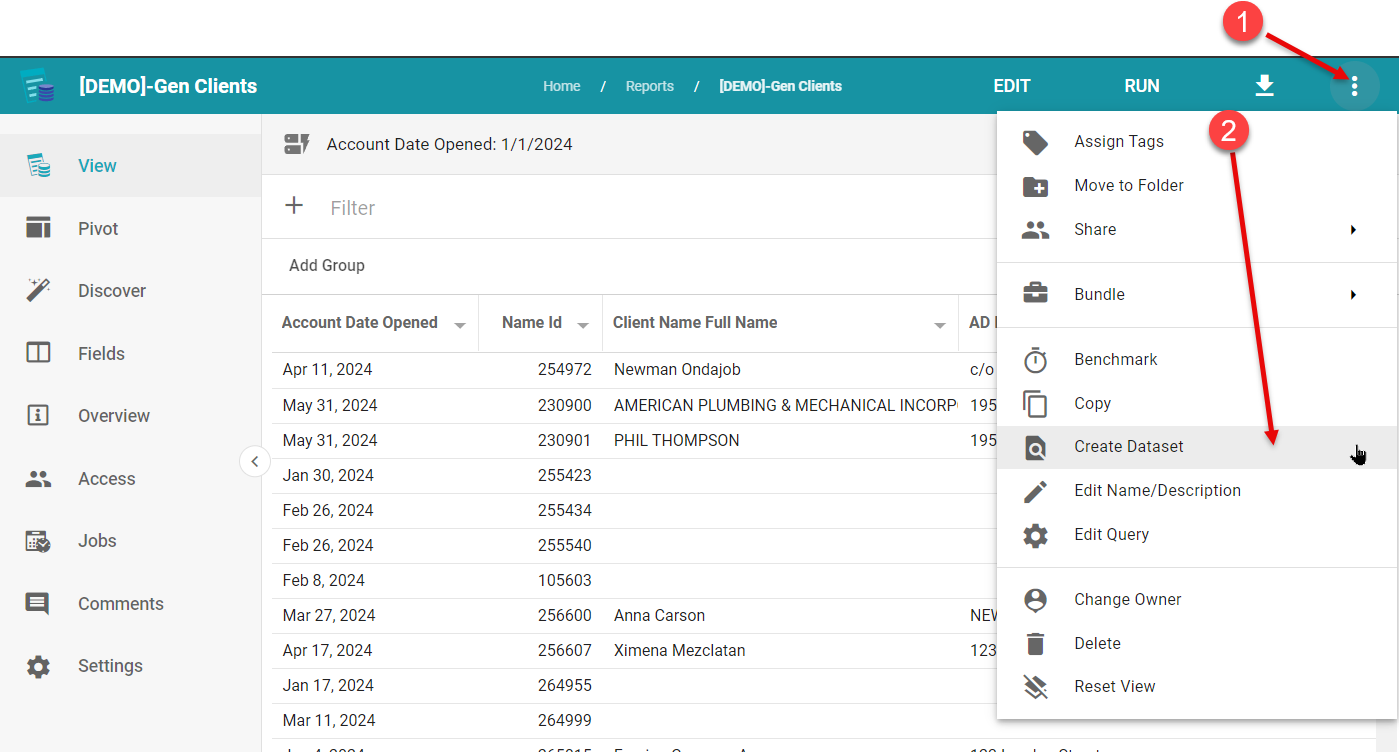
This will bring up a dialog where you can name your Dataset and give it a description.
Once done with that you will be taken to the Dataset view of the report you converted.
Informer Tips
Saved Lists for Revenue Period Filtering
In the Naviga Database there are fields (Period, Financial Period, etc) that are in the format of YYYY-MM.
What if you wanted to have a report run and have whatever the current period is run based on today's date? There is no straightforward way to do this.
However, there is a hack that we can implement to get this to work.
Step 1
Create a dataset that has a Powerscript that creates the Period that you need. Since we cannot just create a dataset that has Powerscript fields, we need to have a "base" dataset to work with. The easiest way to do this is to create an Excel file, drag it to Informer to create a dataset. Then you would add the following code to create the Current Period field:
$record.currPeriod = moment().format("YYYY-MM")
To make things easier, I have created this dataset that you can simply import.
Step 2
Now we need to create a job that will refresh the CurrentPeriod field every day AND the job has an Action that creates a U2 Saved List. This Saved List is what we will use in our Criteria.
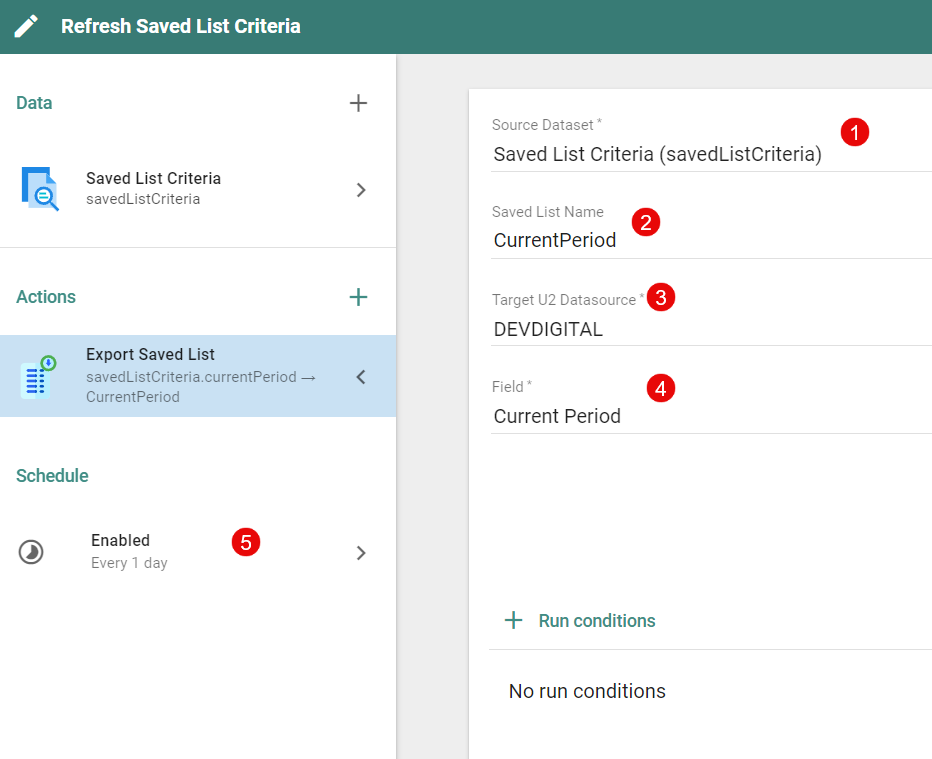
- Source Dataset - This is the Saved List Criteria dataset that you created in Step 1
- Saved List Name - This is how you will reference the Saved List in your criteria. It can be anything, but CurrentPeriod makes sense here.
- Target U2 Datasource - Where are we going to store the Saved List. Could be in any of your datasources, but I like to keep them in the Production datasource.
- Field - This is the field that will be written to the Saved List. In our case currentPeriod.
- Schedule - Make sure to schedule this dataset to run every day at 12:05 am. This ensures that any reports that access it will be getting the correct Period for the current date.
Step 3
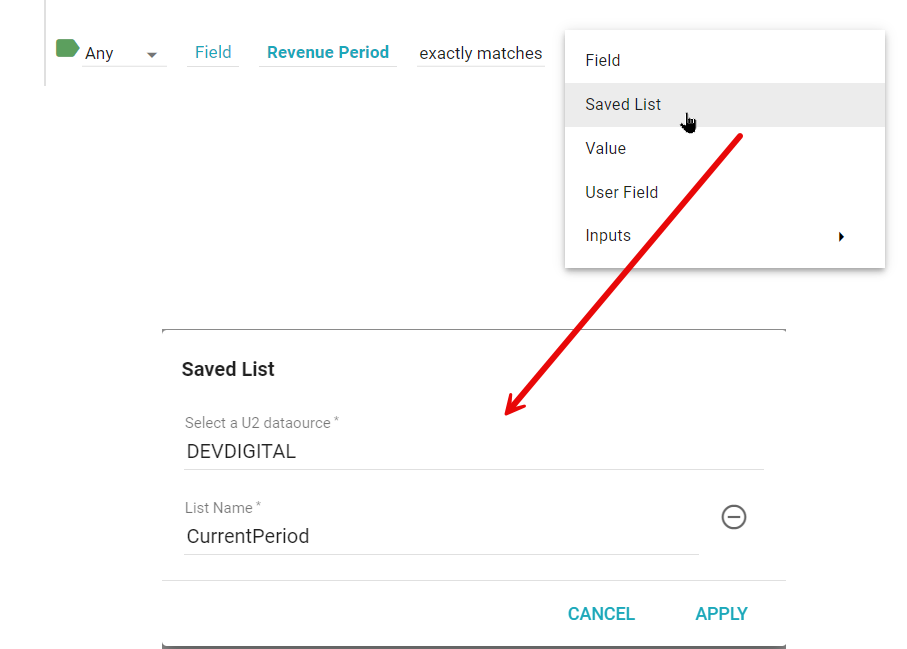
Go to your criteria and use your Saved List!
Current Month - YOY Using Criteria
To pull data for the current month from both this year and last year from a dataset, you can use the following Criteria

This is accomplished by creating a Group in the Criteria section of a query.
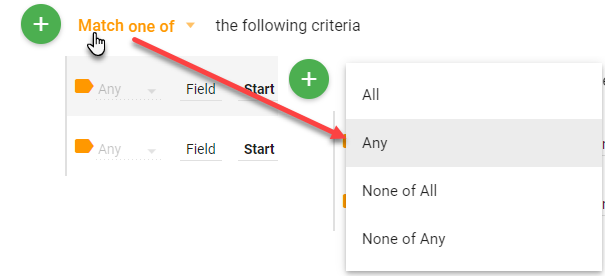
Since you want to get data from both the current month and the current month from the previous year, make sure to mark the group as "Match one of"
Next, add criteria and choose the date field you want to filter on. The first criteria will be using the inclusive between comparison. This will allow you to choose two values for the between to match on.
To make this dynamic, so that you do not need to change the criteria every month, you can use informer keywords to populate our between values. You can access a list of the keywords from within Informer as well:
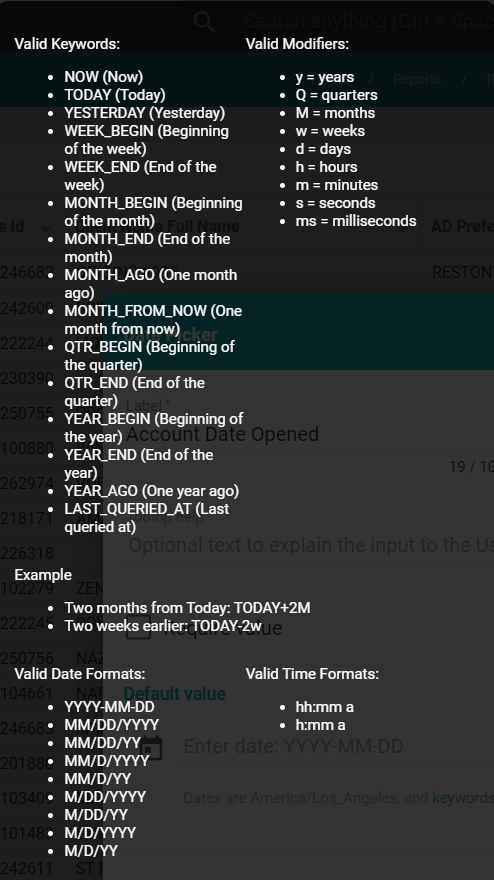
You will populate the two values with MONTH_BEGIN and MONTH_END. This will instruct informer to look at today's date to determine what is the starting and ending of the month.
This will give us the current month's data, but we also want last years data for the same month.
Add a new Criteria row and using the same date field as the other criteria do another inclusive between comparison, but this time instruct informer to pull last years data. Using Informer's keywords MONTH_BEGIN-1Y and MONTH_END-1Y.
Notice all that was needed was using the Years modifier and specifying how many years to subtract.
Current Month - YOY Using a Calculated Field
A calculated field won't limit your dataset, but you can use it to create a field using JavaScript to pull only specific data.
This field doesn't make sense, but, create a Flow Step -> Calculated Field:

If you want to have a field that only contains priceActAmout for rows with a startDate of 2018, do this:
if (moment(startDate).year() === moment().year() - 1) {
  priceActAmt;
} else {
  0;
}
See the Informer JavaScript Docs for more examples of Calculated Fields.
Viewing a Dataset Query
When creating complex criteria, it is sometimes nice to be able to see the query that Informer constructs. This will allow you to verify that your criteria is actually doing what you want it to.
The following can be done when editing a Dataset or Report.
Just click on the ellipses near the Query title and choose View code
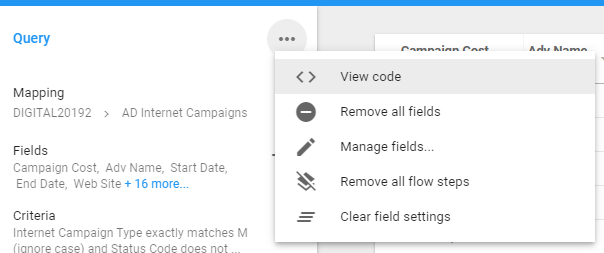
This will pop up a window called Query code. It won't look pretty, but you will be able to see how Informer has interpreted how you built your criteria.
Here is an example:
SELECT INET.CAMPAIGNS WITH (EVAL "OCONV(CAMPAIGN.TYPE,'MCU')" = "M" AND EVAL "OCONV(STATUS.CODE,'MCU')" NE "AC" AND EVAL "OCONV(STATUS.CODE,'MCU')" NE "DE" AND EVAL "OCONV(STATUS.CODE,'MCU')" NE "KI" AND EVAL "OCONV(STATUS.CODE,'MCU')" UNLIKE "Q..." AND ((START.DATE >= "11/01/2019" AND START.DATE <= "11/30/2019") OR (START.DATE >= "11/01/2018" AND START.DATE <= "11/30/2018")))
LIST INET.CAMPAIGNS EVAL "CHAR(244):CHAR(171):CONVERT(CHAR(253),CHAR(250),CONVERT(CHAR(252),CHAR(249),CONVERT(CHAR(251),CHAR(248),CONVERT(CHAR(32),CHAR(7),CONVERT(CHAR(4),CHAR(245),CONVERT(CHAR(13),CHAR(247),CONVERT(CHAR(10),CHAR(246),SUBR('-OCONVS',CAMPAIGN.ID,'MD00'):CHAR(166):ADV.NAME:CHAR(166):AGENCY.NAME:CHAR(166):WEB.GROUP:CHAR(166):STATUS.CODE:CHAR(166):SUBR('-OCONVS',START.DATE,'D4/'):CHAR(166):SUBR('-OCONVS',END.DATE,'D4/'):CHAR(166):SUBR('-OCONVS',COST,'MD22'):CHAR(166):SUBR('-OCONVS',COMMISSION,'MD22'):CHAR(166):SUBR('ESC.AT.V5',WEB.SITE):CHAR(166):SUBR('ESC.AT.V5',PRICE.DESC):CHAR(166):SUBR('ESC.AT.V5',SUBR('-OCONVS',PRICE.START.DATE,'D4/')):CHAR(166):SUBR('ESC.AT.V5',SUBR('-OCONVS',PRICE.END.DATE,'D4/')):CHAR(166):SUBR('ESC.AT.V5',SUBR('-OCONVS',PRICE.PER.UNIT,'MD55')):CHAR(166):SUBR('ESC.AT.V5',SUBR('-OCONVS',PRICE.QTY,'MD00')):CHAR(166):SUBR('ESC.AT.V5',SUBR('-OCONVS',PRICE.EXT,'MD22')):CHAR(166):SUBR('ESC.AT.V5',SUBR('-OCONVS',PRICE.ACTUAL.IMPS,'MD00')):CHAR(166):SUBR('ESC.AT.V5',SUBR('-OCONVS',PRICE.ACT.AMT,'MD22')):CHAR(166):SUBR('ESC.AT.V5',SUBR('-OCONVS',TRANS('INF_INET.ORDERS',PRICE.LINEID,'ACT.AMT','X'),'MD22')):CHAR(166):STATUS.DESC:CHAR(166):WEB.GROUP.NAME))))))):CHAR(187)" CNV "" FMT "80L" ID.SUP COUNT.SUP COL.SPCS 0 HDR.SUP COL.SUP REQUIRE.SELECT
You can go to Instant SQL Formatter to clean up the above query ... a little.
If you look at the Current Month - YOY Example, we create a group and did two inclusive between comparisons on Start Date. If you look at the SQL below, you will see that part of the code start at line 6.
SELECT inet.campaigns with (eval "OCONV(CAMPAIGN.TYPE,'MCU')" = "M"
AND    eval "OCONV(STATUS.CODE,'MCU')" ne "AC"
AND    eval "OCONV(STATUS.CODE,'MCU')" ne "DE"
AND    eval "OCONV(STATUS.CODE,'MCU')" ne "KI"
AND    eval "OCONV(STATUS.CODE,'MCU')" unlike "Q..."
AND    ((
                     start.date >= "11/01/2019"
              AND    start.date <= "11/30/2019")
       OR     (
                     start.date >= "11/01/2018"
              AND    start.date <= "11/30/2018"))) list inet.campaigns eval "CHAR(244):CHAR(171):CONVERT(CHAR(253),CHAR(250),CONVERT(CHAR(252),CHAR(249),CONVERT(CHAR(251),CHAR(248),CONVERT(CHAR(32),CHAR(7),CONVERT(CHAR(4),CHAR(245),CONVERT(CHAR(13),CHAR(247),CONVERT(CHAR(10),CHAR(246),SUBR('-OCONVS',CAMPAIGN.ID,'MD00'):CHAR(166):ADV.NAME:CHAR(166):AGENCY.NAME:CHAR(166):WEB.GROUP:CHAR(166):STATUS.CODE:CHAR(166):SUBR('-OCONVS',START.DATE,'D4/'):CHAR(166):SUBR('-OCONVS',END.DATE,'D4/'):CHAR(166):SUBR('-OCONVS',COST,'MD22'):CHAR(166):SUBR('-OCONVS',COMMISSION,'MD22'):CHAR(166):SUBR('ESC.AT.V5',WEB.SITE):CHAR(166):SUBR('ESC.AT.V5',PRICE.DESC):CHAR(166):SUBR('ESC.AT.V5',SUBR('-OCONVS',PRICE.START.DATE,'D4/')):CHAR(166):SUBR('ESC.AT.V5',SUBR('-OCONVS',PRICE.END.DATE,'D4/')):CHAR(166):SUBR('ESC.AT.V5',SUBR('-OCONVS',PRICE.PER.UNIT,'MD55')):CHAR(166):SUBR('ESC.AT.V5',SUBR('-OCONVS',PRICE.QTY,'MD00')):CHAR(166):SUBR('ESC.AT.V5',SUBR('-OCONVS',PRICE.EXT,'MD22')):CHAR(166):SUBR('ESC.AT.V5',SUBR('-OCONVS',PRICE.ACTUAL.IMPS,'MD00')):CHAR(166):SUBR('ESC.AT.V5',SUBR('-OCONVS',PRICE.ACT.AMT,'MD22')):CHAR(166):SUBR('ESC.AT.V5',SUBR('-OCONVS',TRANS('INF_INET.ORDERS',PRICE.LINEID,'ACT.AMT','X'),'MD22')):CHAR(166):STATUS.DESC:CHAR(166):WEB.GROUP.NAME))))))):CHAR(187)" cnv "" fmt "80L" id.sup count.sup col.spcs 0 hdr.sup col.sup require.SELECT
Loading External Attribute Data
There are two ways to load attribute data (Excel, CSV, etc) for us in Informer:
- Direct Spreadsheet Load into a Dataset - This is a "quick and dirty" way to quickly get data from a spreadsheet into Informer. This is only recommended for data that you will not be loading often and is generally NOT the way to get external data into Informer.
- **Create a Workspace for External Data** - This is the recommended way of importing external data. It is more stable and easier to use than option 1.
Regardless of the method that you use to import the data, you will need to make sure that you know how the data that you are going to import will join to the existing Informer data.
An example would be period dates if your corporation has periods that don't follow the calendar. in this case you would create a spreadsheet that might look something like this:
| ext_period_date | ext_period_year | ext_period | ext_period_week |
|---|---|---|---|
| 01/01/2021 | 2021 | 1 | 1 |
| 01/02/2021 | 2021 | 1 | 1 |
| 01/03/2021 | 2021 | 1 | 1 |
| ... | ... | ... | ... |
| 03/04/2021 | 2021 | 3 | 1 |
In the above case, you would join the ext_period_date to whatever date field in your report needed to be expressed in your corporate periods.
Excel To Dataset Direct
Just a reminder, this is NOT the recommended way to bring in external data, but is a quick way to test how data might link.
One example of external data that would work would be extra customer attributes that are not in the main database, old account number, other name, etc.
Here is an easy example. I have a dataset in Informer with a bunch of information, one of them being the Agency Name. I also have an external spreadsheet with the Agency Name and an Agency Alias.
The end goal is to link the spreadsheet to the dataset on Agency Name.
To do this, you first must create a dataset from your external spreadsheet. You can accomplish this in a number of ways, here are two:
-
Go to the Datasets page in Informer and drag and drop your Excel file
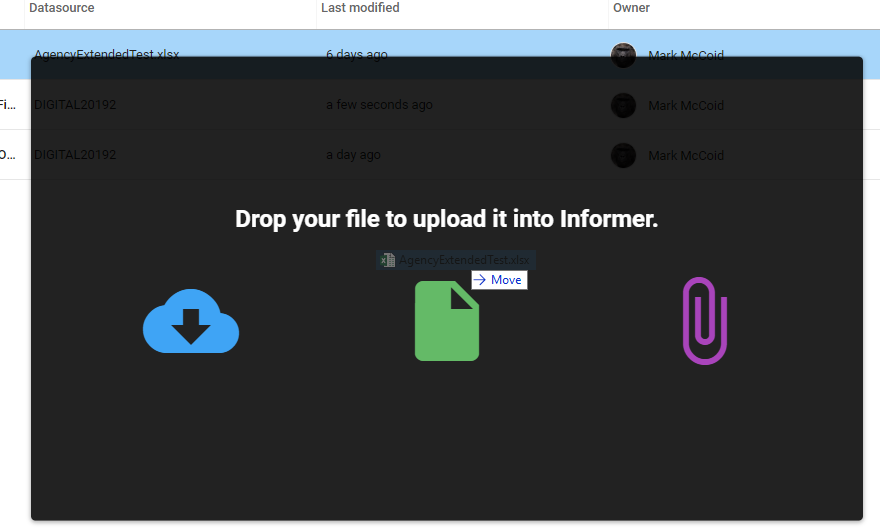
You will the dialog above, simply drop the file here.
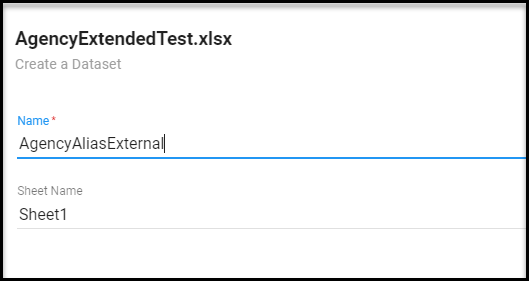
Give the dataset a name and choose the sheet (this is an excel file) that the data is located on.
-
OR, Click on the New button and choose Dataset then upload a file:
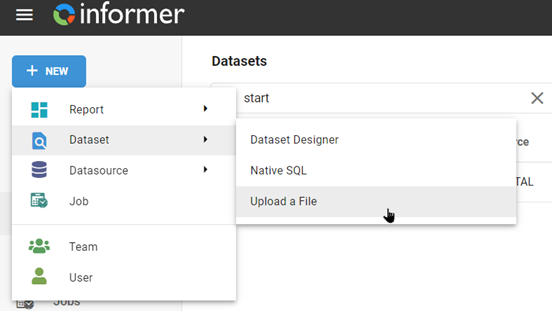
Then choose a file and fill in the Dataset name and Sheet name where data is located.
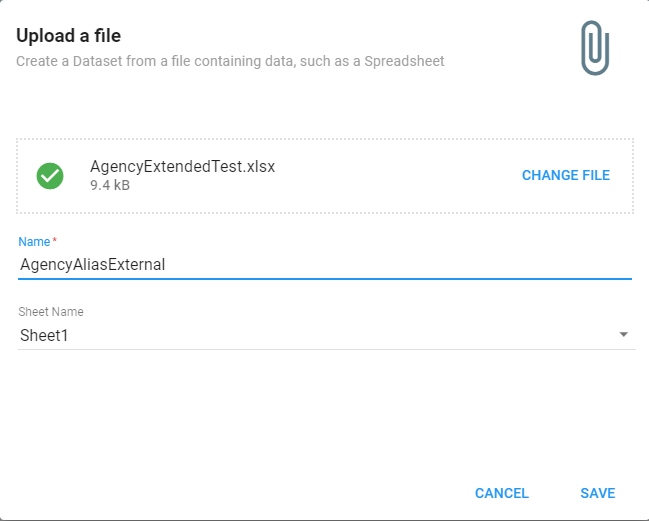
Click Save.
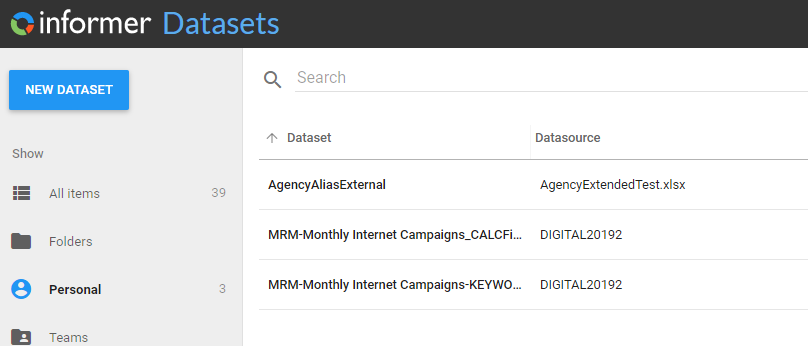
This will upload the data in the external file and create a new Dataset. You will see it in your list of Datasets:
Link Data to Another Dataset
To get the Agency Alias into another Dataset, simply open the Dataset that you want to append the external data to and create a field using the Flow Step, Add Field/Fields from another Dataset
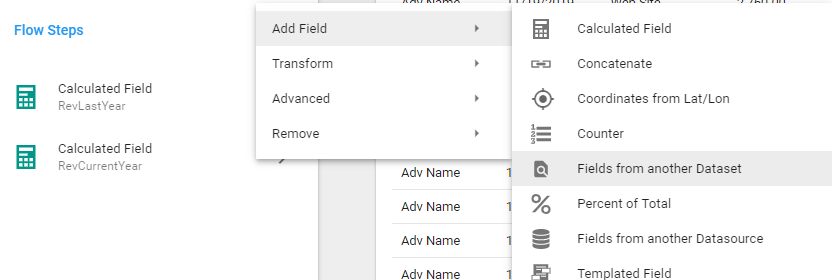
This Flow will have you select the dataset where the target field resides (AgencyAliasExternal Dataset) and then you must link these Datasets by choosing the fields from each dataset that will create the link. In our case, it is simply the Agency Name.
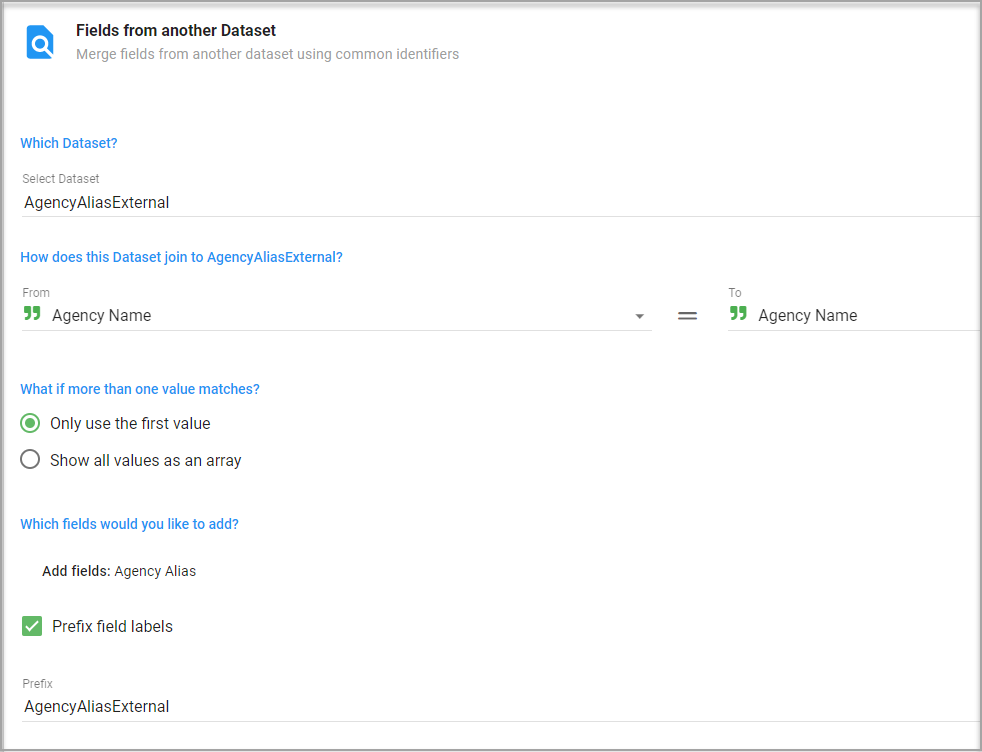
The other important setting is choosing the fields you would like to. Click and add the fields that you want. In this example, it is just the Agency Alias.
The What if more than one value matches? option can be left as Only use the first value.
The Prefix field labels setting allows you to add a prefix to these import fields so that you can better identify them as coming from another dataset. It is optional.
Using Workspaces
A workspace is a Datasource that holds mappings of any external data that you want to import. You can think of a Workspace as a database or your external spreadsheets.
First you need to create a Workspace to load your external data into. Go to the Datasources area in Informer, click on NEW DATASOURCE and then choose Workspace.
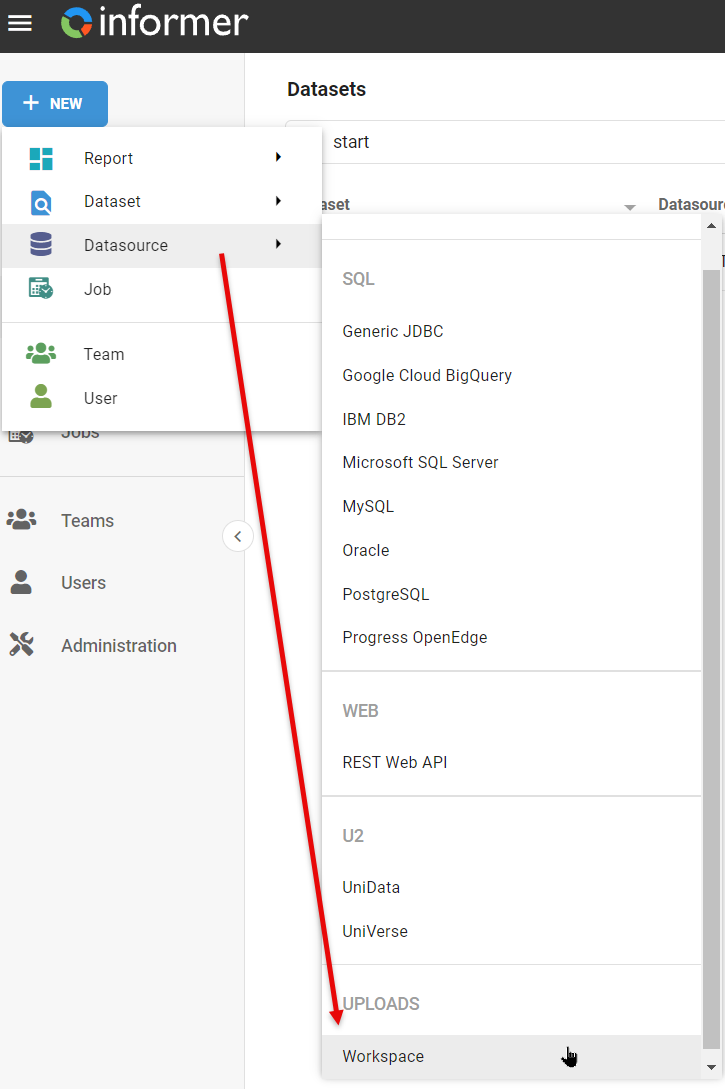
Enter a name for the workspace. How about External Data. You can house multiple excel files or other external data source within a single datasource.
Once you create Workspace, you will have an UPLOAD DATA button in the middle of the screen. Press this button and either click on Choose Files or drop the file containing your external data into the gray square.
Recommended File structure:
- CSV Format - Instead of Excel, CSV format is preferred.
- Header Names - Make them lowercase and if the header has multiple words, separate each work with an underscore.
- Period Date becomes period_date
Once you drop your file, it will load and analyze it. If you haven't followed the above rules, you may see this screen:

If so, click on Configure and then on the magic wand next to the Field Name label. This will simply rename your header names into a form that Informer can use.

Lastly, click Import. You now have a new mapping in a Datasource named External Data that can be used just like any other mapping.
This means that you could create a Dataset with any mapping in your External Data Datasource OR you could join the field to an existing Dataset using the flow step Fields from another Datasource.
Flow Steps
Normalize
Splits array values into individual rows for each value in the array.
I tested on a dataset that had multiple array fields in it and when I normalized on all of the array fields, it "lined" up the arrays.
Without Normalize flow step:

With the Normalize flow step:

If your query contains a one to many join (think order to order details type query), Normalize will duplicate the "one" fields for each "many".
If you don't normalize, you will get something that looks like you have multivalued fields.
Filters
Filters can be found in many places within Informer. Their main purpose is to further limit the data that has been loaded in a Dataset or Ad Hoc Query Report.
Filters applied from different areas will work a little differently and it is important to understand how they differ.
Accessing the Filter
When you filter a Report, Ad Hoc Query Report or Dataset, there will be multiple areas where you can access the filter options.
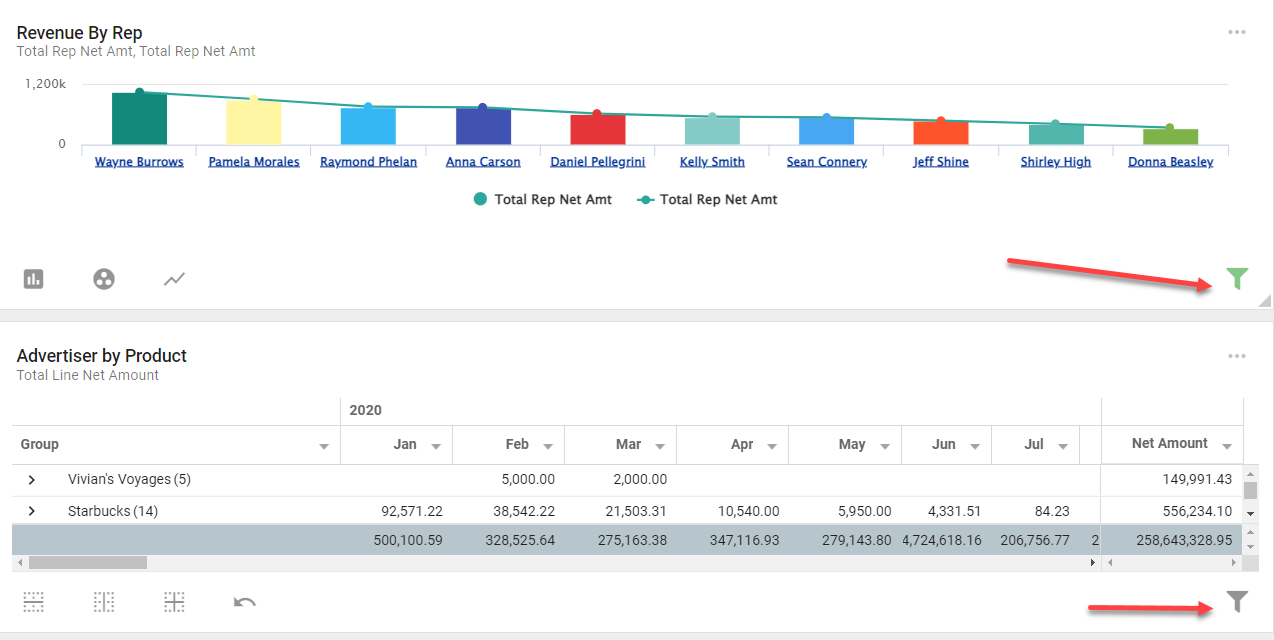
Within a Dashboard, Comparison or Data View report, you can get to your filters:
-
Editing the Report - When in edit mode, you will be able to apply a filter individually for each visual within the report. This is useful because these filters will be saved with the report and visuals allowing you to set the initial view/filter of the data for users.
-
User level Visual filters - Users can set their own (modify any filters the report writer set while in edit mode) for each visual.
-
Top Level Of the Report - Your end users can choose to apply a filter at the top level of a report. The filter set at this level will apply to all visuals within the report and will be "ANDed" with any filters set on the individual visuals.

Saving Report Filters
Ad Hoc Reports
If you save a filter on an Ad Hoc report, it will be saved for your user. I have found no way to share this with any other users.
Other Reports based on Datasets
If you need to be able to share filters, you will want to make sure your data is coming from a Dataset versus an Ad Hoc Report.
The Reports AND the Datasets feeding the reports must BOTH be shared with the Team or Users who you want to be able to interact with it.
Whenever a user (or the creator) of the report creates a filter in the report, it will be saved as a private filter on the underlying dataset. If you want other users to see the filter, you will need to open the Dataset and mark the filter as public.
Variables / User Fields
User Fields can be created on the Administration panel by click on the User Fields option.
Once a user field has been created, you can assign it to a user(s) and give it a value. Then you can access any user field in either criteria or filters to limit the data based on the value in these users fields.
Filtering - Variables. You can setup certain variables that are unique for each user. For example, Department could be a variable that would be each users department so when they ran the filter it would automatically filter by their department.
Filters - Using Dates
Date Keywords
Using Date keywords in your filters will allow you to get dynamic date filtering. Meaning this filtering will update based on the current date when the filter is run.
Here are the keywords:

WEEK_BEGIN, WEEK_END are keywords not listed in box above, but are available to use.
All keywords resolve to a single date. For example TODAY will be today's date. YEAR_BEGIN will be January 1st of the current year. I believe NOW is the only keyword to incorporate the current time.
The Keywords by themselves would allow us to do a whole lot, but the modifiers really add power.
The modifiers allow you to take the date returned by the Keyword and change it by years, quarters, months, weeks or days.
For example, if the filter needed is Start of the Year two years ago through the Current Start of the Year. If today's date is 5/5/2020, the filter being requested is:
01/01/2018 through 01/01/2020
Using the modifiers we can accomplish this as follows:
- YEAR_BEGIN-2y = 01/01/2018
- YEAR_BEGIN = 01/01/2020
You can have one modifier modifying each Date Keyword. You cannot do something like this: YEAR_BEGIN-2y+2m
To accomplish this you would instead do:
YEAR_BEGIN-22m
BUG ALERT - I did find an issue when trying to use YEAR_BEGIN with no modifiers. It didn't return anything. To make it return the current YEAR_BEGIN adding a + or - after it seemed to work: YEAR_BEGIN+
To create a filter using Date Keywords, select the Date keyword option, which will show in your filter options if you are on a field typed as Date.
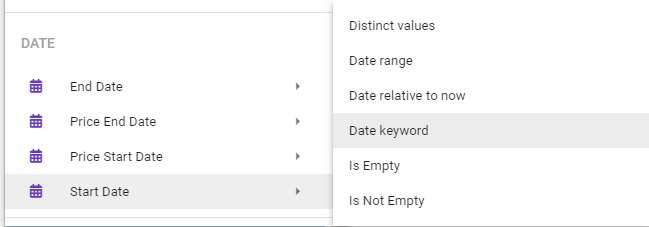
This will present you with a side bar area where you can build your filter.
When building your filter, another feature of Date keywords that you need to understand is how to tell your filter how to filter on the date keyword you create. You have the following options:
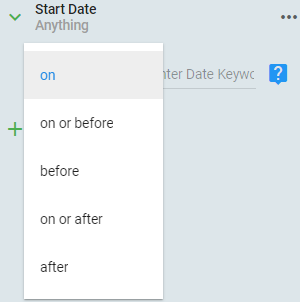
In the example below, assume the Date Keyword is YEAR_BEGIN and it will return a date of 01/01/2020 and the field being filtered is StartDate
-
on - Only return records that match the date returned by your Date Keyword.
StartDate = 01/01/2020
-
on or before - Return records where dates are less than or equal to the date returned by your Date Keyword.
StartDate <= 01/01/2020
-
before - Return records where dates are less than the date returned by your Date Keyword.
StartDate < 01/01/2020
-
on or after - Return records where dates are greater than or equal to the date returned by your Date Keyword.
StartDate >= 01/01/2020
-
after - Return records where dates are greater than the date returned by your Date Keyword.
StartDate > 01/01/2020
You can create multiple rows in your filter to achieve the filter that you want.
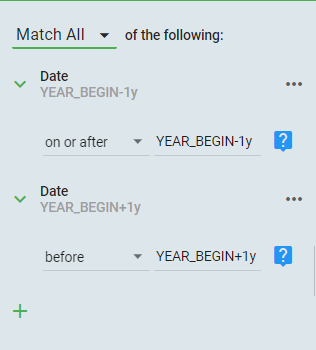
An example would be creating a filter that would select all dates from the beginning of the previous year, to the end of the current year. Please note there are multiple ways to structure this filter, I will only present one.
If today's date is 5/5/2020, our filter should do the following
StartDate >=01/01/2019 and StartDate < 01/01/2021
Date Relative to Now
Date Relative to Now creates a filter that lets you look into the past or future in relation to today's date. The first field will be either 'Next' or 'Past'. The middle field is a positive integer that needs the final field to tell the filter if it will be days, weeks, months or years.
Keep in mind that when filtering for the Next/Past of anything, it doesn't take the current date to be part of the Next/Past selection.
Past WILL include today's date in the filtered dates
Next WILL NOT include today's date in the filtered dates
Some examples based on Today's Date of 1/13/2020
- Past 2 Days - Returns 1/11/2020-1/13/2020
- Past 2 Weeks - Returns 12/30/2019-1/13/2020
- Next 2 Months Returns 1/14/2020 - 3/31/2020 - Notice it returned the Next full 2 months
Date Range
The tried and true date range is simply that. Enter a starting and an ending date range to filter on.
Distinct Values
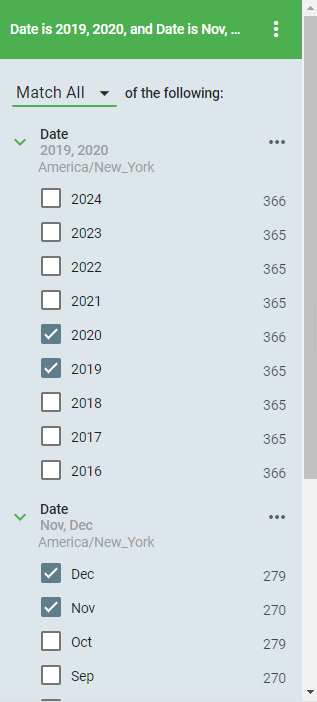
Allows filtering by Years, Months, etc. If the filter needed is Nov and Dec of 2019, 2020, Distinct Values will get you there.
When you choose Distinct Values on a Date field, you will initially be presented with the years available in the date field to select. However, by clicking on the ellipses you will have the option to change the date period to something else.
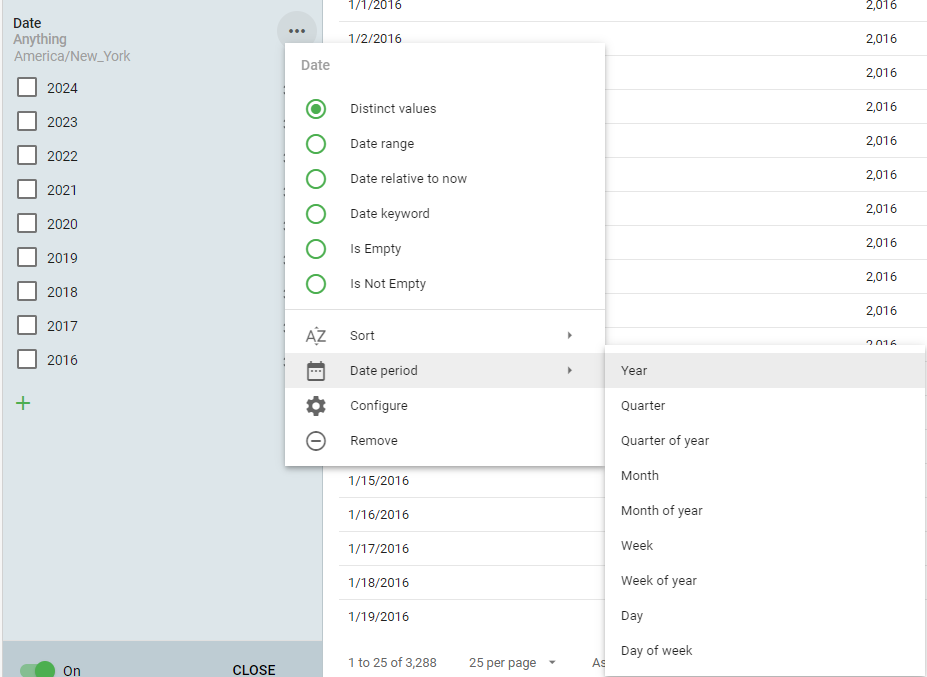
In our example, filter by Nov and Dec of 2019 and 2020, you would need to add two Distinct value filters. The first for the years and the second for the months. It would like like this:
Bundles
A bundle in Informer is a specialized, portable package designed to facilitate the export (backup) and import of your Informer Ad Hoc reports and Datasets between different Informer environments.
You can use bundles to backup Ad Hoc report or Datasets to your local machine. We also use bundles to "point" a report to a different datasource. Lastly, you will find bundles within this documentation which allows you to import the report examples shown here.
A bundle is exported to your device as a TGZ file (a special zip file).
How Bundles Work in Practice
- Creating/Exporting a Bundle: Users with appropriate permissions can select one or more resources (such as Datasets or Reports) and export them as a bundle. The system ensures that all necessary dependencies are included.
- Importing a Bundle: To import a bundle into Informer, users simply drag the bundle file and drops on the Informer interface. A dialog will pop up with options on the import process.
Exporting a Bundle
While there are a number of ways to export/create a bundle, the focus here will be how to export a bundle from a Ad Hoc Report or Dataset.
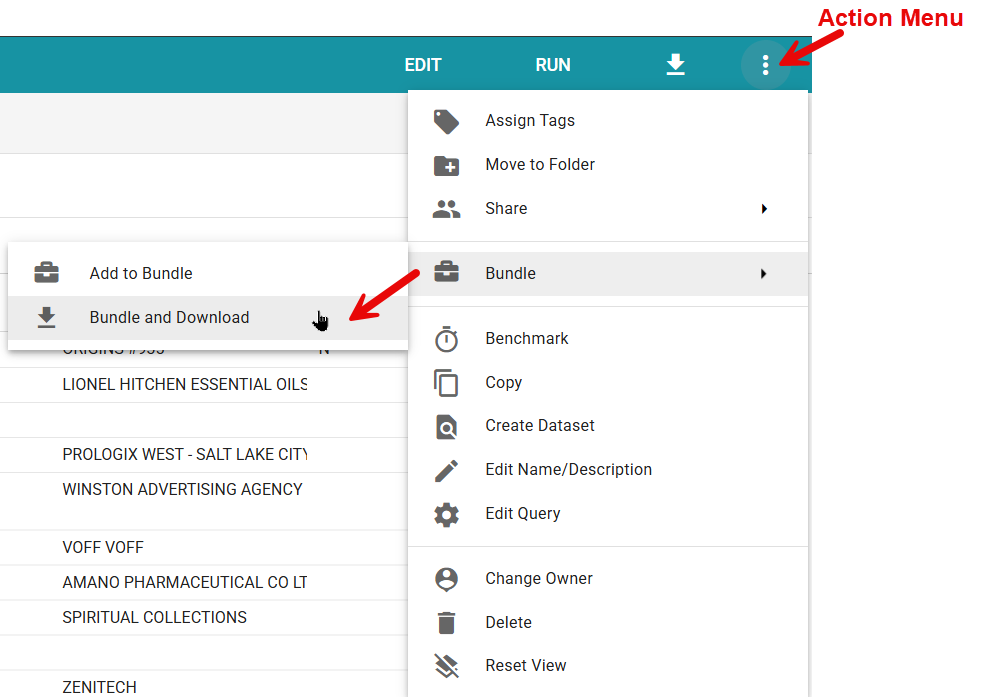
In an Ad Hoc Report or Dataset, simply click on the Actions menu on the right hand side of the screen and choose Bundle/Bundle and Download. Be patient as if there are any dependencies, it may take a few minutes to build and download.
Once done, you will have a .tgz downloaded to your computer. This is the Bundle.
Importing a Bundle
Importing a Bundle is very easy, however there are few key things to understand.
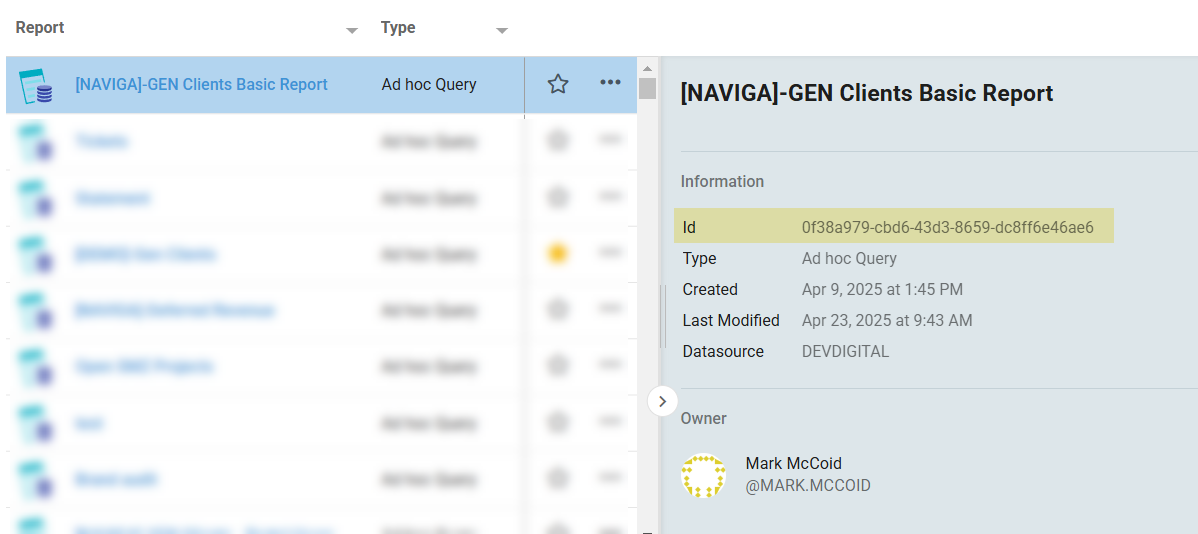
Every Ad Hoc Report and Dataset has a Name, but this is not what uniquely identifies them, instead, it is the Id field.
When you are in the Reports area, click on the report to select it, then in the right hand pane you will see some additional information. The Id being one of them. This is important to understand because it means that you can import reports with the same name but different Ids. This can be confusing.
It is also important to understand this when importing so that you don't overwrite a report that has had its named changed, but the report Id is the same. This could happen if someone imports a bundle renames it and starts making changes to it. Then six months down the line, they import the old bundle again and accidentally overwrite the report they have been working on for six months!
We will see how to keep this from happening!
On to importing your bundle.
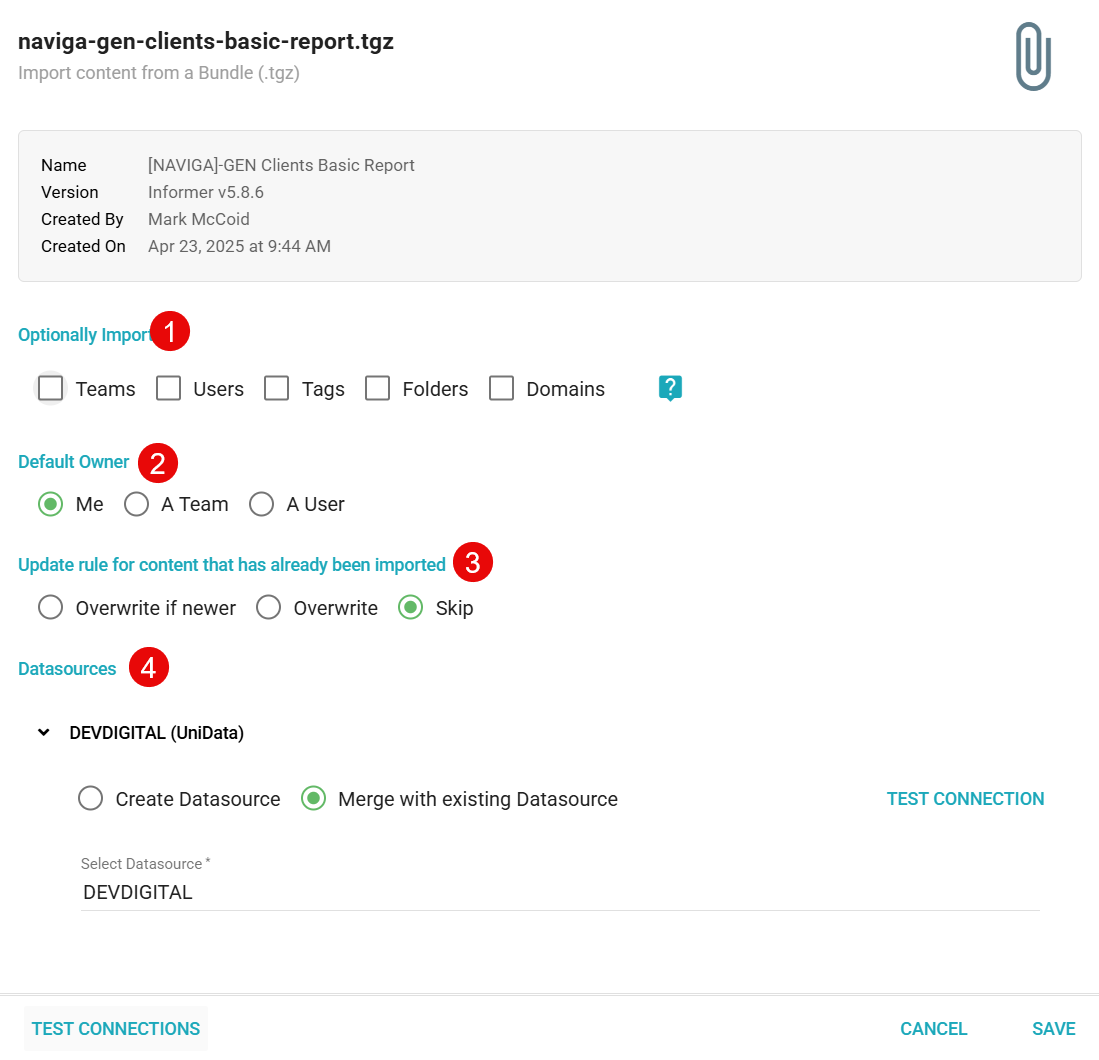
Drag the .tgz file onto the Informer interface and drop it. When you do this a Dialog will open.
Optionally Import- Usually best to clear all checkboxes. If you need teams, users, etc. add them after the import.Default Owner- Here you can choose who will own the Report after the import. This can also easily be changed after the import is done.Update Rule...- I usually choose "Skip" to be safe. As I said above, if you have a report with the same Id, you could accidentally overwrite if "Overwrite" was chosen. Skip is a safe option.Datasources- This will allow you to choose which Datasource the report should pull its data from. You should always choose "Merge" and then the Datasource you want.
Lastly, click on Save and the report will be imported.
Datasets
The data in a Dataset will be persisted. Meaning that once loaded, it will be available for future use, while the Ad Hoc query's data is dumped after it is done being used.
Persisted but not updated data would work for historical data, but for reporting that requires current data the dataset data must be refreshed at certain intervals to be useful.
You can do this by scheduling a job to run to refresh your datasets.
Copying Datasets
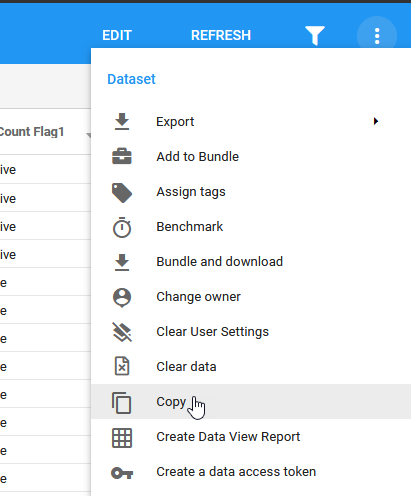
It is very easy to make a copy of an existing Dataset. Simply click on the vertical ellipses in the upper right hand corner of the Dataset screen and choose Copy. Give your copy a new name.
This will NOT copy any Visuals or Filters that you have stored in the Dataset. To get Filters and/or Visuals copied into a new dataset, following the Bundle Copy method below.
Copying Dataset to Different Datasource
If you develop a Dataset in one Datasource and want to move or copy it to a new Datasource, you will need to follow these steps.
NOTE: There is currently a "bug" in Informer which causes you any saved Visuals and Filters on the dataset to be lost when performing the copy. Unfortunately, this is the only way to point a Dataset to a different Datasource.
Step 1
Make a copy of the Dataset in question. This is very important, you must have a COPY of the dataset.
Step 2
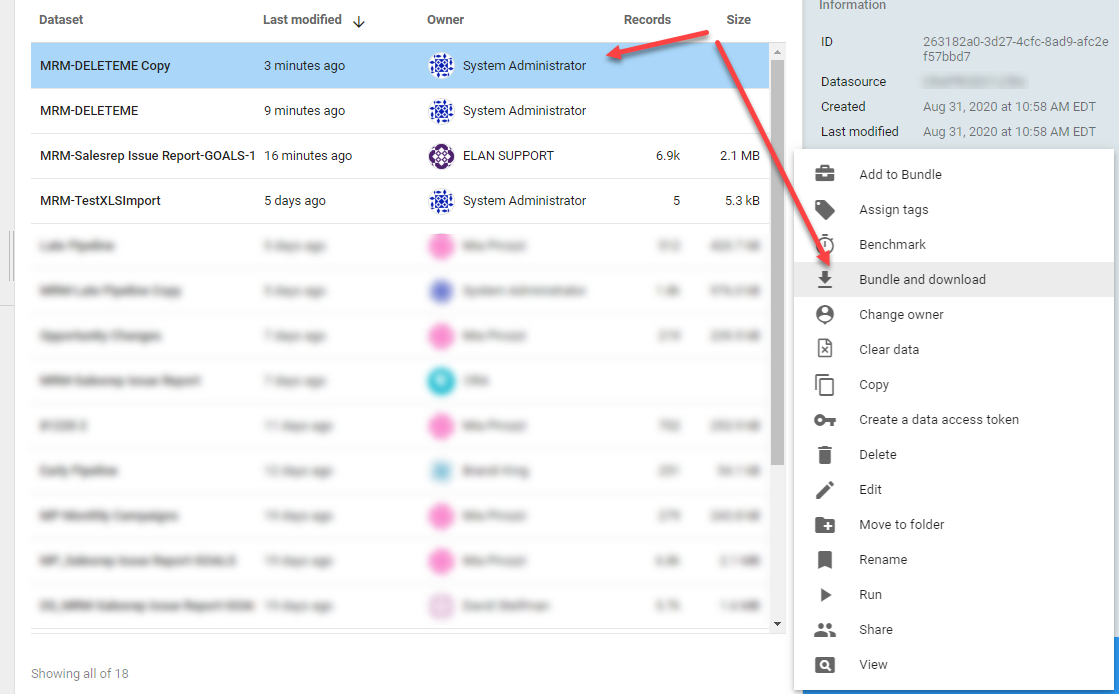
Highlight the copied Dataset, click on the Actions menu and choose Bundle and download
Step 3
Delete the Dataset that you just bundled and downloaded. You need to do this so that in the next step when we reimport the dataset (even though we will point to a different Datasource) it doesn't conflict with an existing dataset.
Step 4
The Bundle and download step will have created a tgz file in your download directory. This is the file that you will need to drag and drop onto the Dataset window.
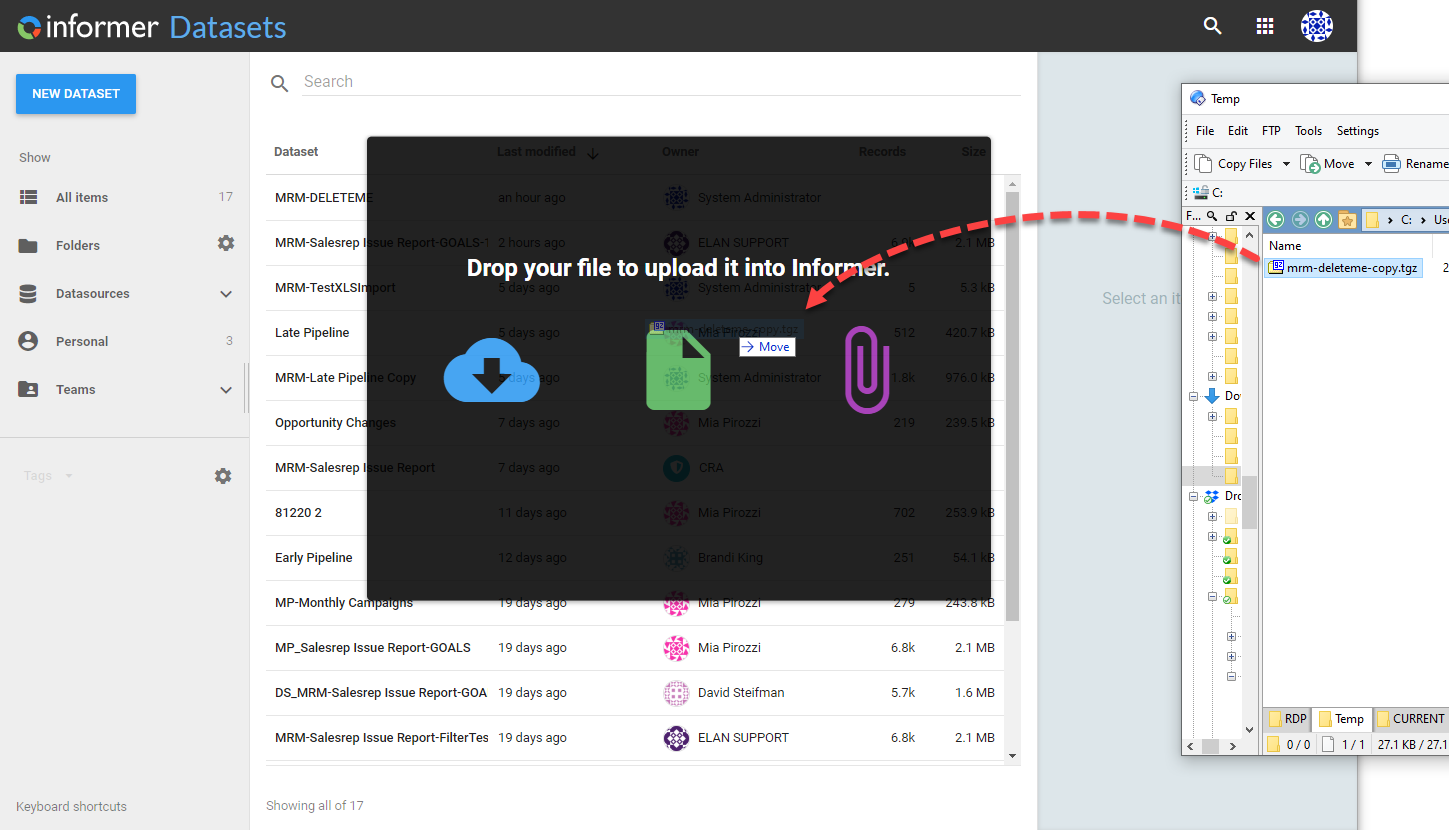
Once you drop this file in the Dataset window, it will pop up with a dialog where you can set the options for the import.
You can choose to import items like Teams, User, Tags or Folders.
You can also change the default owner.
You will want to leave the Update rule to "Overwrite if Newer".
And lastly, if you want this imported Dataset to point to a new datasource, then change the datasource listed in the "Select Datasource" section.
You want to also leave it as "Merge with existing datasource".
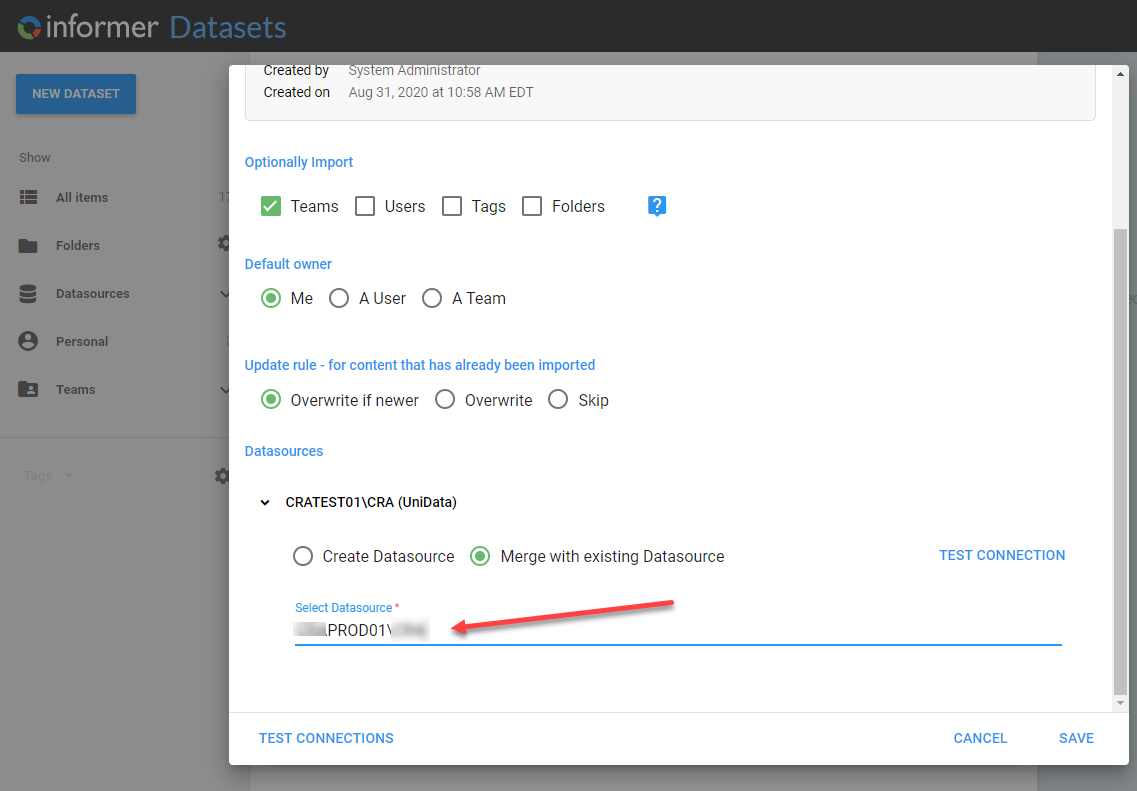
Click on Save and then verify that the new Dataset has been created.
I have seen times where if steps are not followed, that the target Datasource may get renamed. If this ever happens you simply need to rename the Datasource back to its original name.
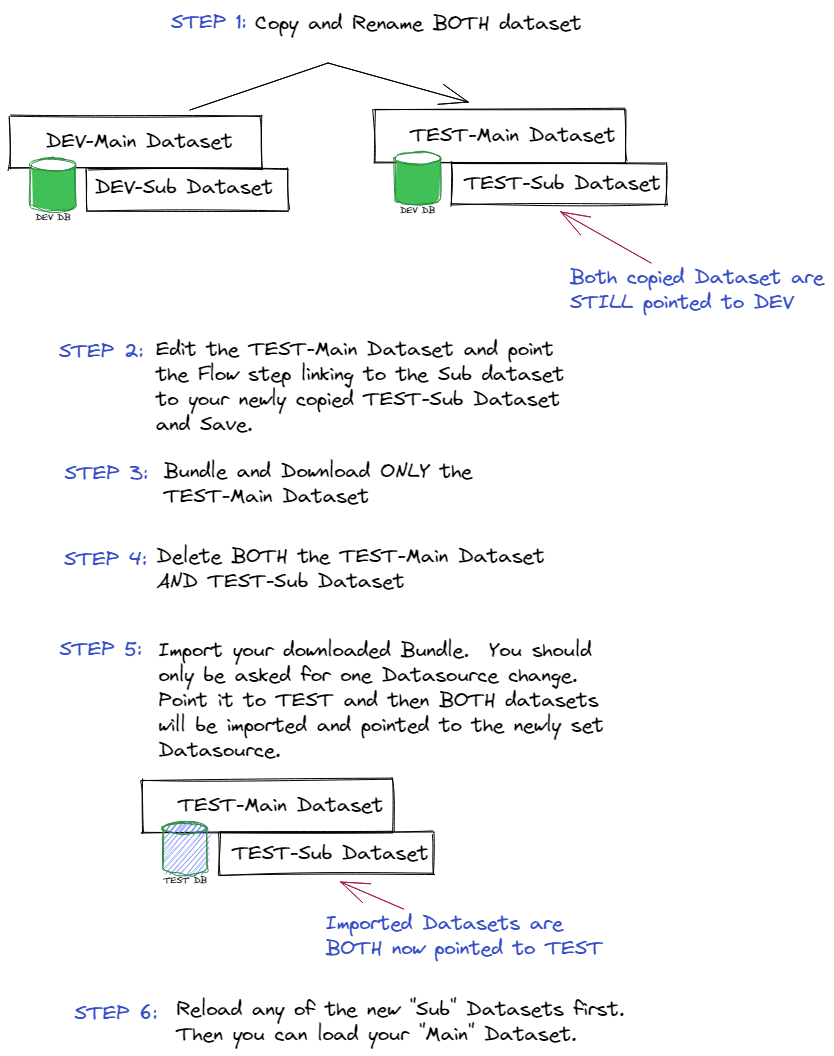
BUT WAIT, what if you have embedded Datasets in your Flow steps? Then things get a bit more complicated. Below is a visual to describe the steps.
The key to remember is that ALL of the datasets NEED to be pointing to the same Datasource, otherwise when importing you will see an input for multiple datasources and your import will fail.
Datasets Owned by Teams
If you want to allow certain users (who are not super users), the ability to edit and refresh a Dataset, you must make that Dataset owned by a team.
Then any users who are Data Wizards or above on the Team the Dataset is owned by, will have the ability to Refresh the Dataset.
There two other very important steps:
-
You must share the Datasource with the Team that the Dataset is owned by.
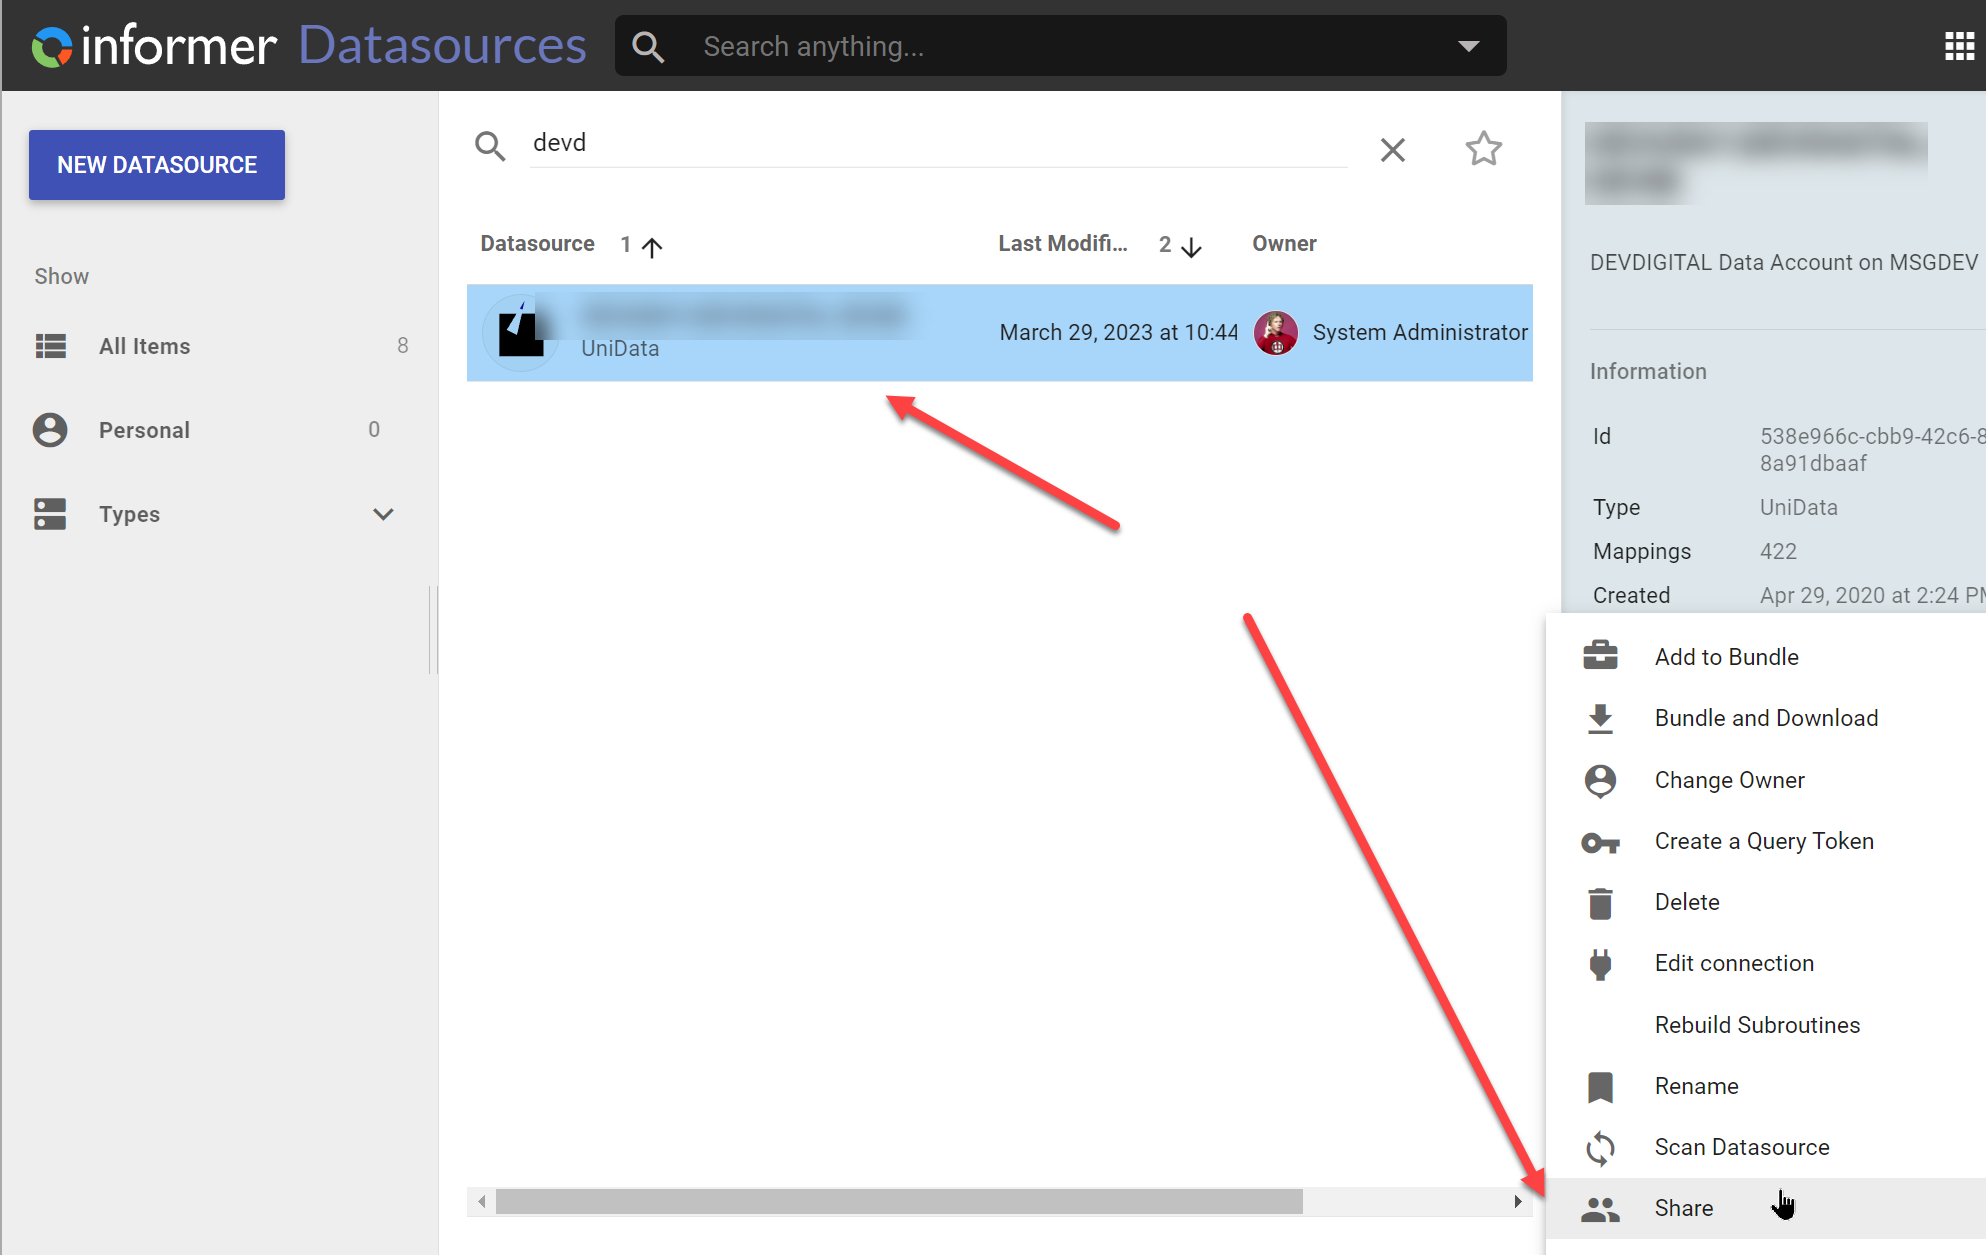
-
You must turn OFF the Row Filter plugin
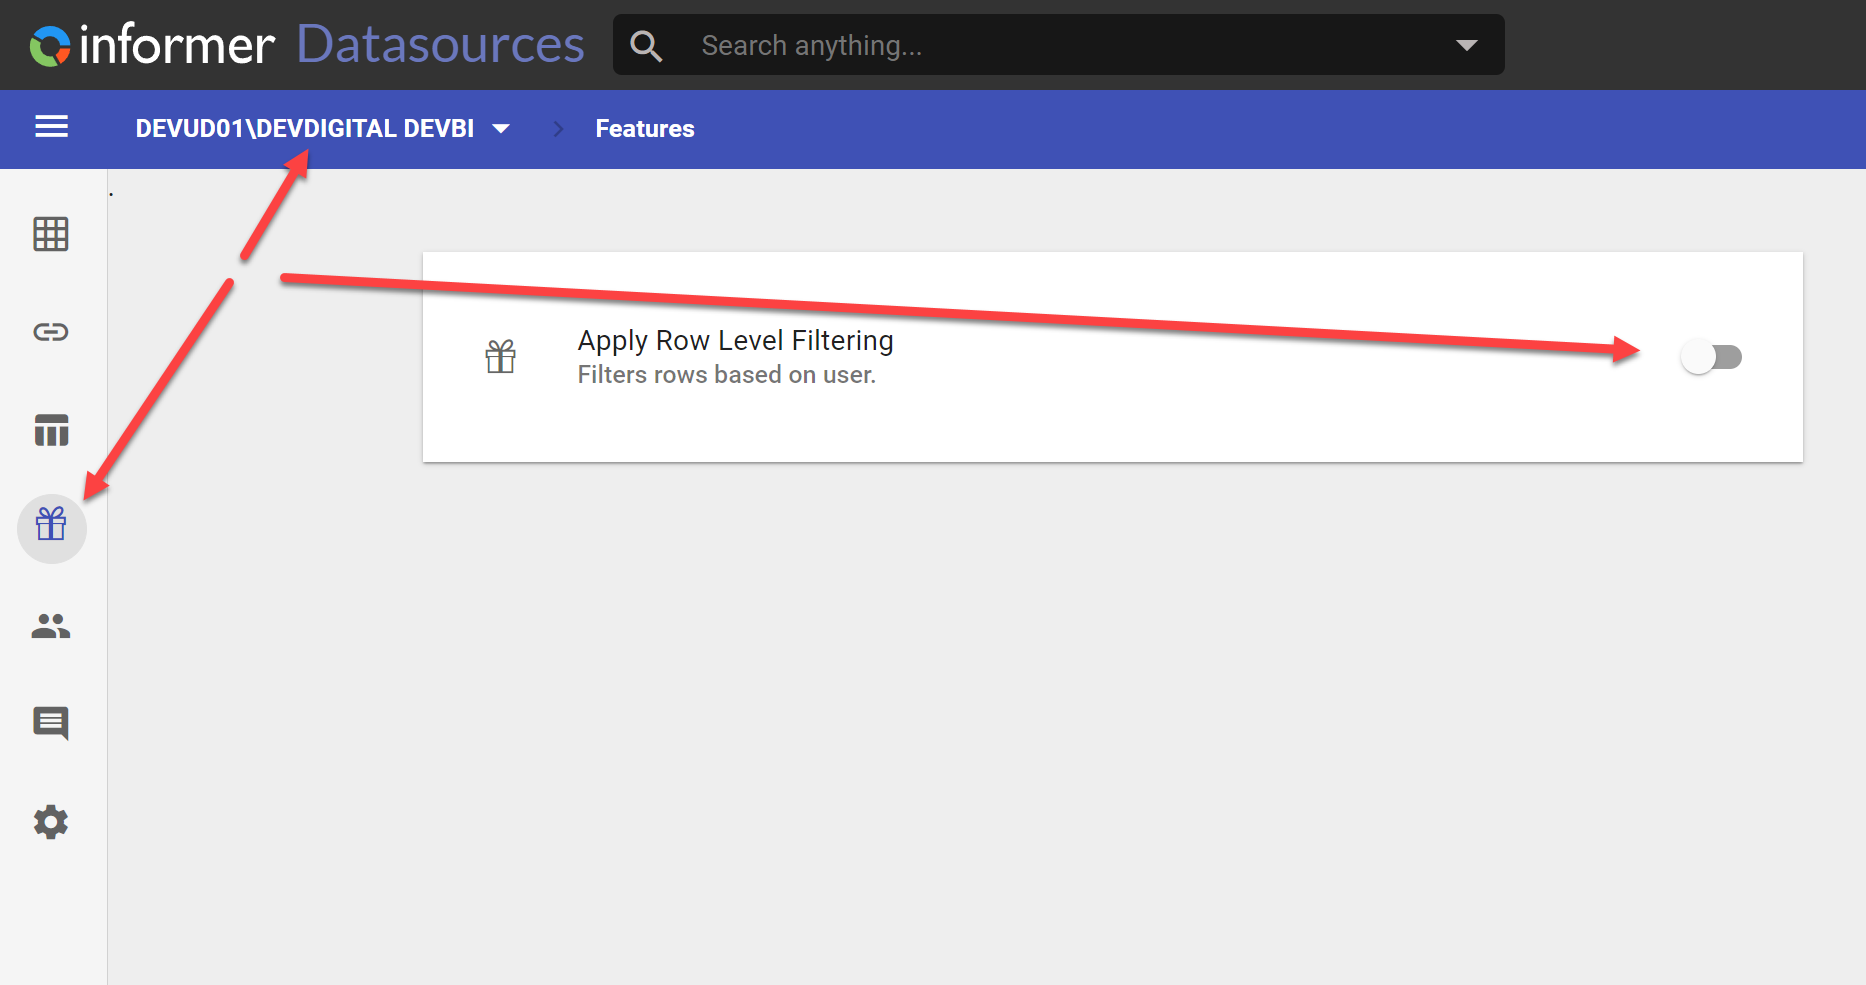
Jobs Owned by Teams
If you want a Job to also have a Team for an Owner, the dataset that is in the Job must also be owned by the Team.
Jobs & Emails
Jobs are the Informer way to take some sort of action.
- Emails are sent as part of a Jobs.
- Jobs are also used to schedule the reload datasets.
You can pair the reloading with Actions like emailing, however, you don't have to. Each dataset in a Job has a check box "Refresh on job run" that will determine if the dataset will be refreshed before the other actions in the Job are run.
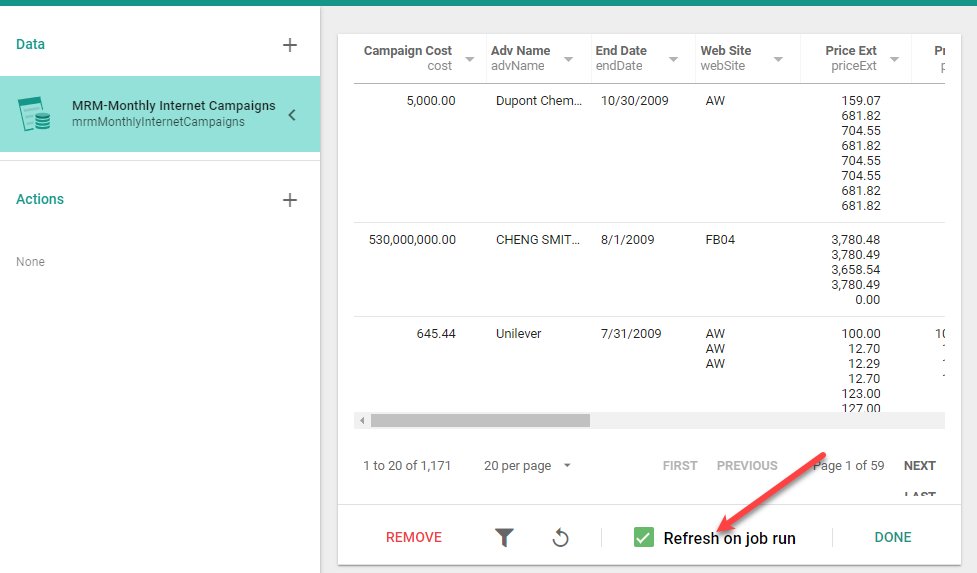
A job is made up of two parts, the Data and the Actions.
You can have a Job with just Data (probably for a reload) or just Actions, you don't need both.
Job Dataset Not Updating
If you update a Datasets Query definition AFTER you have already added it to a job(s), be aware that the change will NOT automatically be propagated to the jobs that "use" the dataset.
Changes to Datasets post being added to a Job do not reflect changes made to the Dataset.
This is by design. Why? - Informer does not want to introduce unforeseen changes to a query definition in a Job that is running in the background. It is then an opt-in approach.
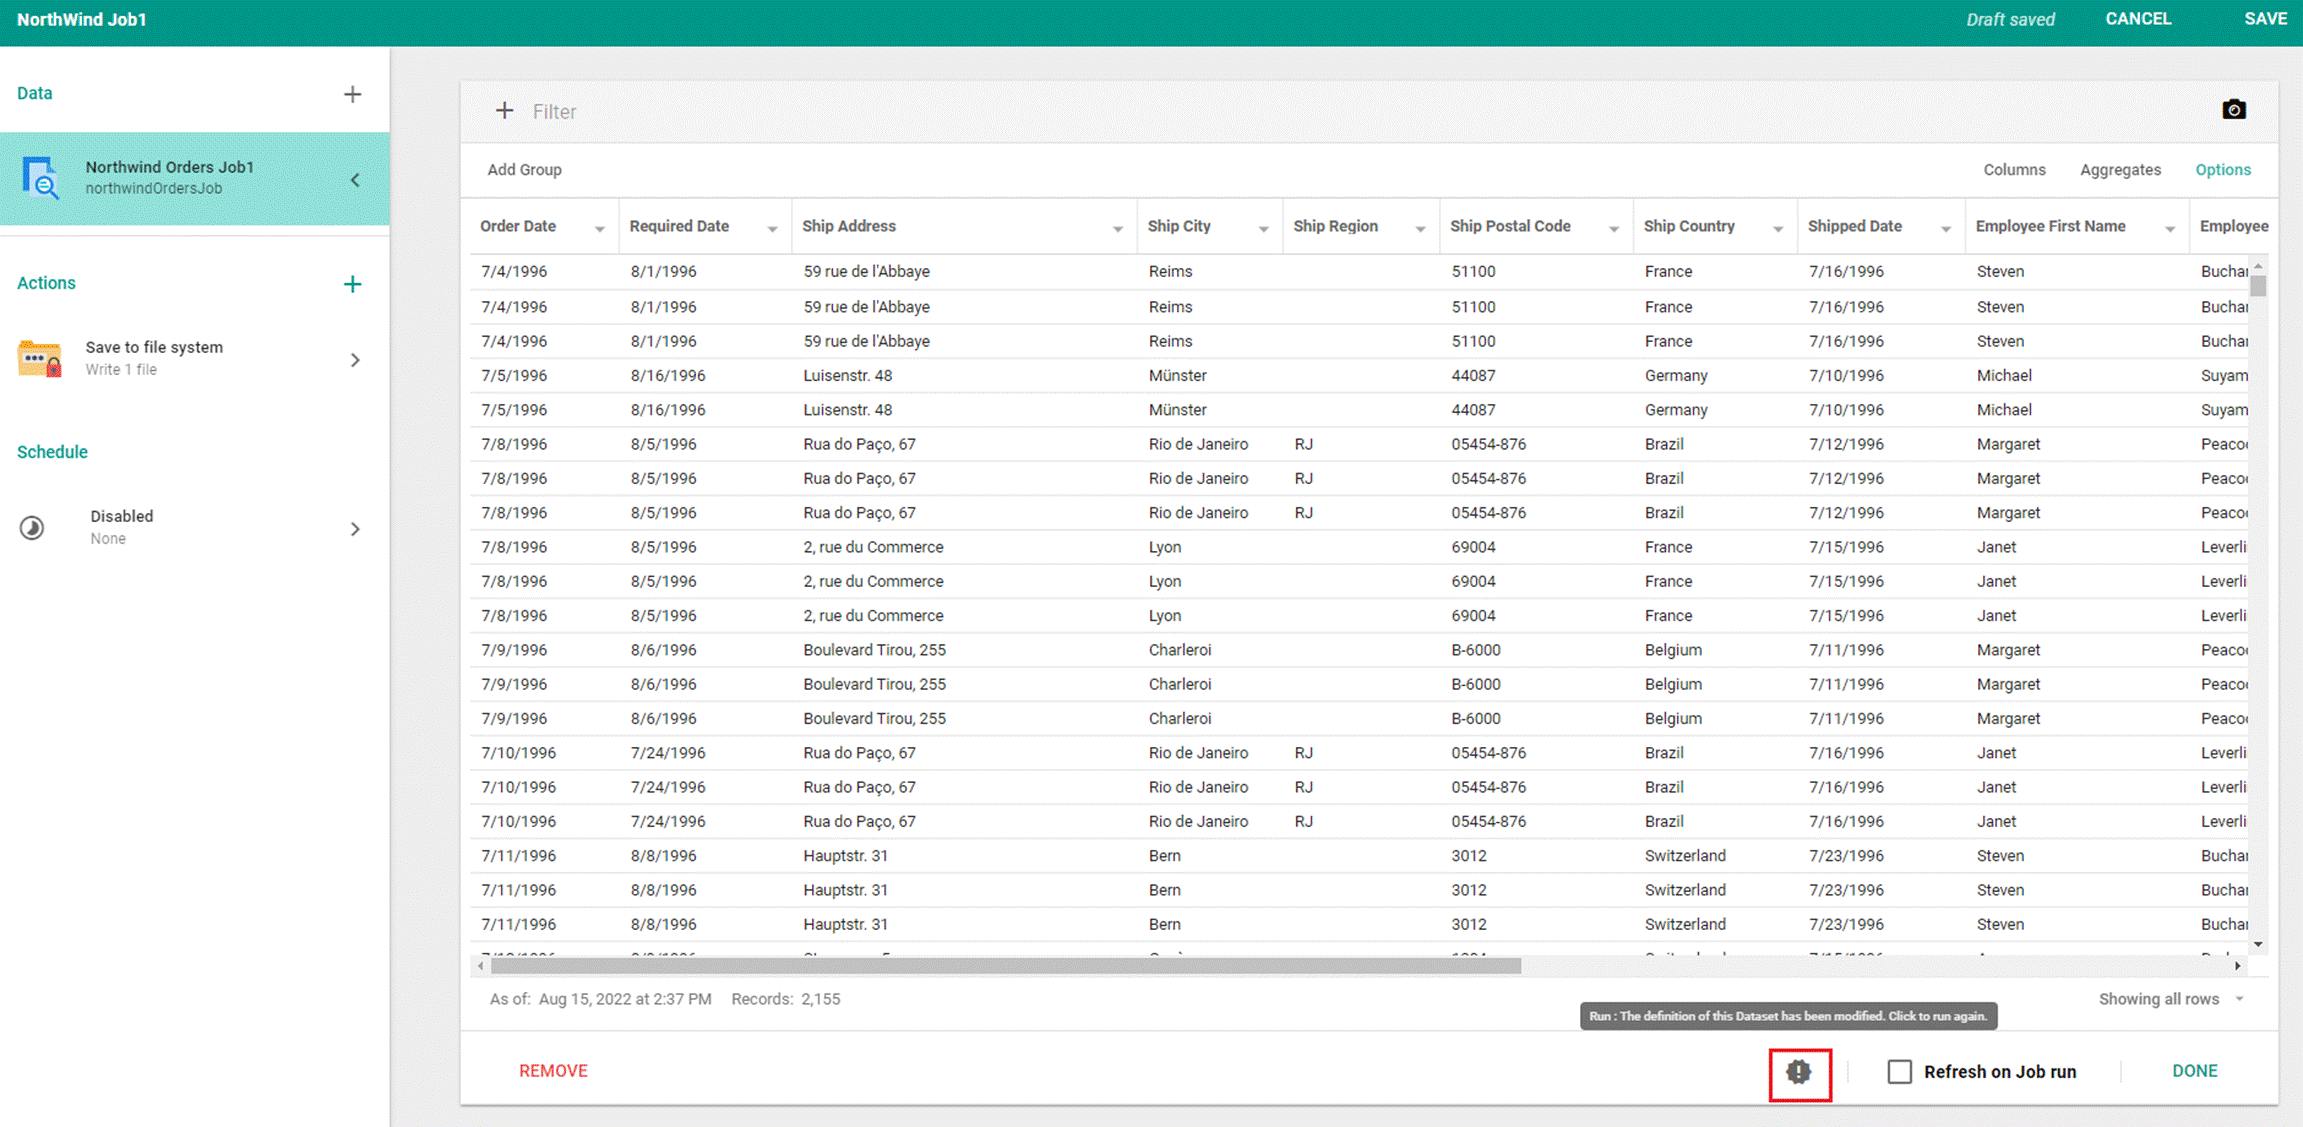
When there are changes made to the underlying query used in a Job, the Data value under the Job will have an indicator next to the Refresh check box—showing that that query has changed and allows to accept those changes or not.
See the screenshot below. It is from 5.6, where the note that the underlying query has been modified. To then push the changes from the query click the button.
Job Data Options
The data for a job can be either a Dataset or a Query. The Query being one of your Ad-Hoc Reports.
You can have multiple Data objects in a single job. This would allow you to refresh both data objects as well as send email that included data from both Data objects.
Job Actions
You have five actions that you can perform in a job. They are:
- Send an Email - Sends an email to users that enter. This is an option where a single email will be generated and you will have to fill out the email addresses that the email is going to. This is useful for reports that you know who the recipient will be
- Send an email burst - An email burst uses the data in the dataset to get the email addresses to send emails and data to. This is what I would call a loop and reduce, since it will not only use an email field in the dataset to determine who to send the email to, but will also reduce the data so that the email recipient only gets the data they are "associated" with.
- Send to FTP - This option is NOT available. If you try to use it, it will not work.
- Send to file system - This option will let you export to a Naviga designated FTP site. See Exporting To The File System
- Export Saved List - this will create list in a Datasource
Job Scheduling
The whole point of a Job is to allow you to schedule it to run a certain times without external input.
To set the schedule, you will click the switch next to the Schedule to activate it:
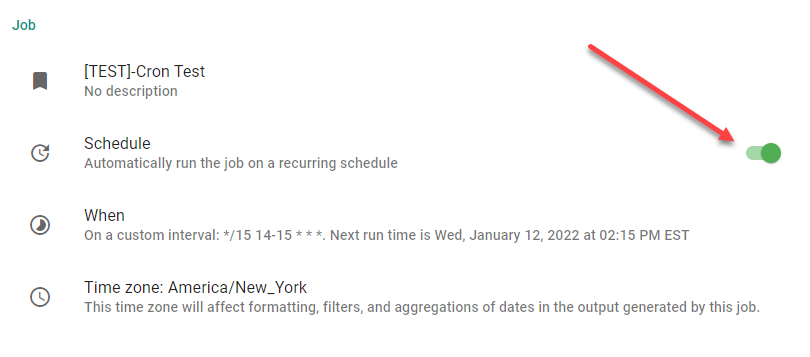
Now, you have access to the When area. For the most part, this area is self explanatory, however, there is one option that is a bit confusing.
You will note, that if you need to do any complicated schedule, like refresh every 15 minutes between 10am and 2pm Monday through Friday, if not possible with the base options.
It is possible with the Custom interval.
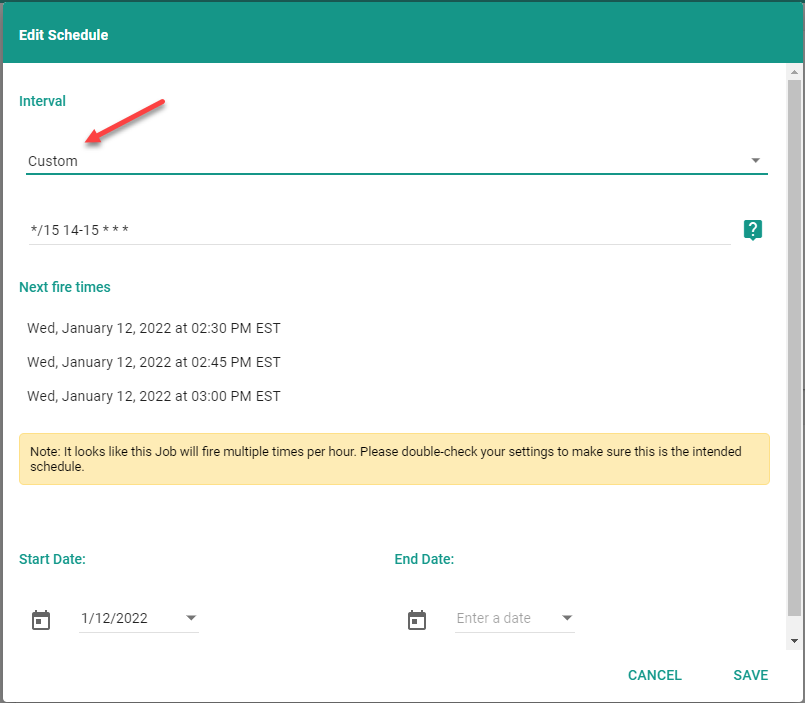
The custom interval is a CRON expression. If you are unfamiliar with CRON expression, this site is very useful:
Here is the CRON Expression for refresh every 15 minutes between 10am and 2pm Monday through Friday
``*/15 14-15 * * 1-5`
Breaking this apart:
- */15 - every 15 minutes
- 10-14 - between 10am and 2pm
- * - every day of the month
- * - every month
- 1-5 - only on Mon - Fri
Useful CRON Information
Informer uses Vixie-style (POSIX) cron
minute hour day-of-month month day-of-week year
Run Job on the Last Day of Every Month
45 22 L * ?
| Minute | Hour | Day Of Month | Month | Day of Week | Year |
|---|---|---|---|---|---|
| 45 | 22 | L | * | * |
- Minute (45): The job will be triggered when the clock reaches 45 minutes past the hour. In this case, the job will run at 22:45.
- Hour (22): The job will run at 22:45 (10:45 PM) in the specified time zone.
- Day of the month (L): The letter "L" represents the last day of the month. Therefore, the job will run on the last day of each month.
- Month (*): The question mark "*" is used as a placeholder, indicating that the job is not restricted to a specific month. It will run regardless of the month.
- Day of the week (*): The asterisk "*" indicates that the job will run on any day of the week. It is not limited to a particular day.
- Year (empty): Since the year part is left empty, the job will run every year.
To summarize, this CRON job is scheduled to run at 22:45 (10:45 PM) on the last day of every month, regardless of the day of the week or the year.
Day Of Month Position
| Minute | Hour | Day Of Month | Month | Day of Week | Year |
|---|---|---|---|---|---|
| L |
The Day of the Month portion of the CRON expression is very versatile. Here are some ways you can use it.
In the day of the month field of a CRON expression (3rd position), besides the "L" that represents the last day of the month, you can use the following conventions to get the exact days you need your Job to run.
- Specific Day of the Month: You can specify a particular day of the month using a numeric value between 1 and 31. For example, "1" represents the first day of the month, "15" represents the fifteenth day, and so on.
- Multiple Specific Days: If you want to schedule the job on specific multiple days of the month, you can separate the values with commas. For example, "1,15" will schedule the job on both the first and fifteenth days of the month.
- Range of Days: You can specify a range of days using a hyphen (-). For example, "10-15" will schedule the job on the days 10, 11, 12, 13, 14, and 15 of the month.
- Step Values: Step values allow you to specify intervals within a range. For example, "*/2" in the day of the month field will schedule the job every two days. Similarly, "3-15/2" will schedule the job every second day between the 3rd and 15th of the month.
Day of Week Position
| Minute | Hour | Day Of Month | Month | Day of Week | Year |
|---|---|---|---|---|---|
| * |
Here are some options to customize the Day of Week that the Job will run:
- Numeric Values: You can use numeric values ranging from 0 to 7, where both 0 and 7 represent Sunday, 1 represents Monday, and so on, up to 7 representing Saturday.
- Names of Days: Instead of numeric values, you can also use the names of the days of the week, such as "Sun" for Sunday, "Mon" for Monday, and so on. The specific names may vary depending on the CRON implementation or software you are using.
- Asterisk (*): The asterisk "*" is a wildcard character that indicates the job should run on any day of the week.
- Multiple Days: If you want to schedule the job on specific multiple days of the week, you can separate the values with commas. For example, "Mon,Wed,Fri" will schedule the job on Mondays, Wednesdays, and Fridays.
- Range of Days: You can specify a range of days using a hyphen (-). For example, "Mon-Fri" will schedule the job from Monday to Friday.
Send an Encrypted Email Attachment
The standard email Action allows you to attach your data output in a number of formats. However, if you need to send out the attachment in an encrypted Zip file, you need to follow the steps below.
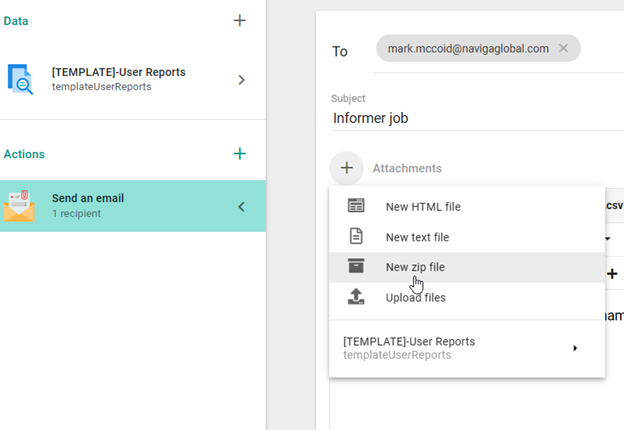
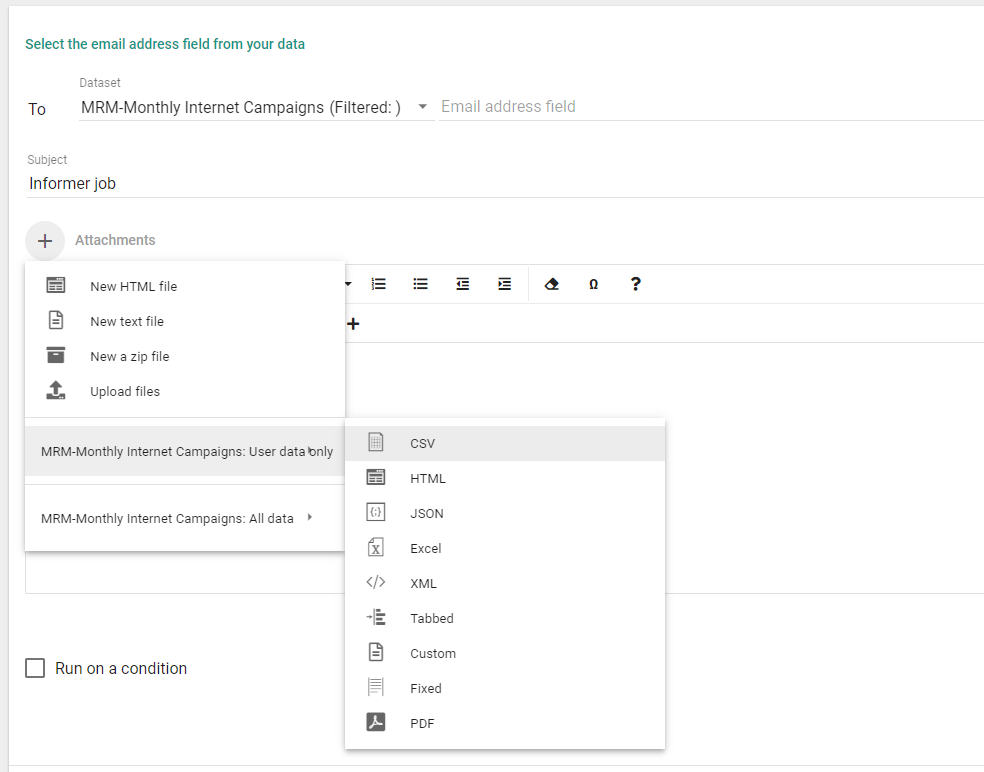
From the "Send an Email" action, click on the attachments icon and choose New zip file
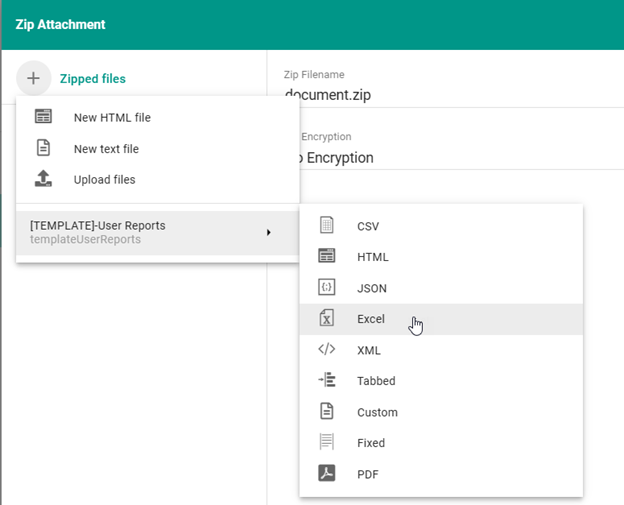
From the Zip Attachment dialog, click on the + icon and choose the type of file to export in the zip file:
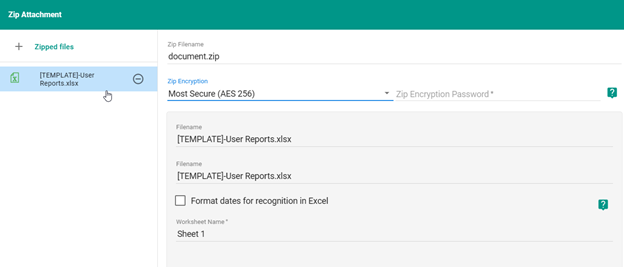
In the Zip Attachment dialog, fill out the required information.
Email Burst Job Action
An email burst uses the data in the dataset to get the email addresses to send emails and data to.
This is what I would call a loop and reduce, since it will not only use an email field in the dataset to determine who to send the email to, but will also reduce the data so that the email recipient only gets the data they are "associated" with.
You can choose to attach the data associated with the user email and/or include the full set of data.
Creating Dynamic Export File Names
When attaching a CSV or Excel file to an email or when sending to the File System or FTP, it is sometimes useful to be able to make the name unique based on the run.
The option that you have in an Informer Job is to introduce date information into the file name. You will be able to do this when you add an attachment to a Job Action.
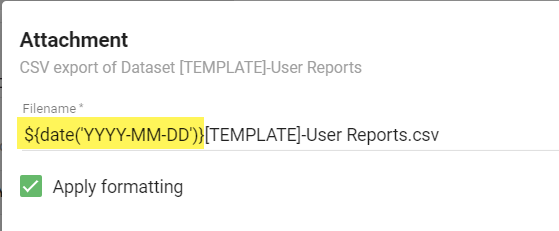
As noted in the screenshot above, you can use the following syntax to add a date component to your file name:
${date('YYYY-MM-DD')}
The format string above ('YYYY-MM-DD'), is a Moment JS formatting string. You can read more about it:
Official Moment JS Docs on Formatting
Alerts for Failed Jobs
There is no direct way to get an email or other notification that a job has failed, however, you can create a new Datasource in Informer that points to the metadata database that informer maintains.
This database contains tables that hold information about the Informer system, including jobs.
Setup Informer Metadata Datasource
Export a Pivot Table via a Job
When you create a Pivot Table, you can manually export it to a CSV file. You cannot export it to any other format like PDF, etc.
You also will NOT have an option to export a pivot table through a Job.
Jobs only have access to the top level data. Meaning any visualizations you create on a Dataset or through an Ad Hoc Report will not be available in a Job for export.
You can however, in a round about way, make your visualization available to the end users who receive emails via your Jobs.
What is the End Result
Instead of email the users an Excel file or CSV file, we will be emailing them a link to a visual on a Dataset. The "Visual" will be of the Pivot table.
Once they have access this Pivot table, they will be able to export it at that point to a CSV or Excel file.
Step 1
The first step is to create the Pivot Table that you want your end users to have access to.
This can be done directly on the Dataset or through a Dataview report. However, even if you create the visual through a Dataview report, it will still be saved on the Dataset.
From a Dataview report, create the desired Pivot table and then click on the horizontal ellipsis in the right hand corner and choose "Save pivot to visuals"
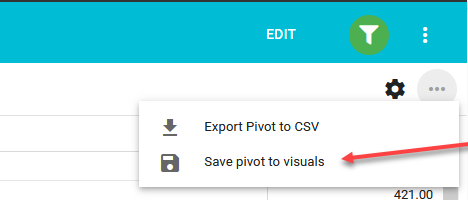
This will not save the pivot anywhere in the report, but instead will save it to the underlying Dataset that is driving the report.
You can then view the saved visual by opening the Dataset and clicking on the "Visuals" icon:
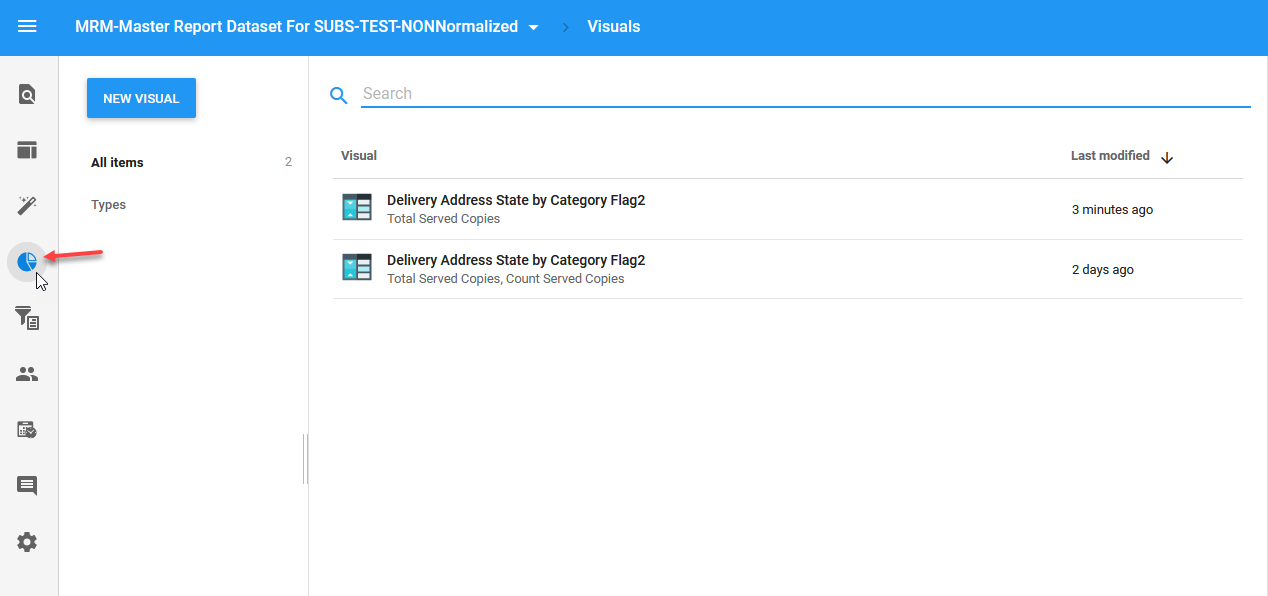
You can also create new visuals from this area also.
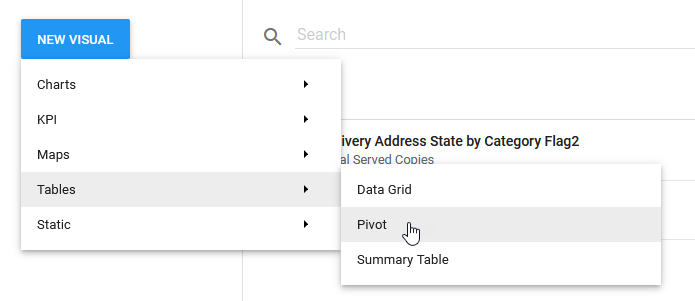
Just click on the New Visual / Tables / Pivot:
Step 2
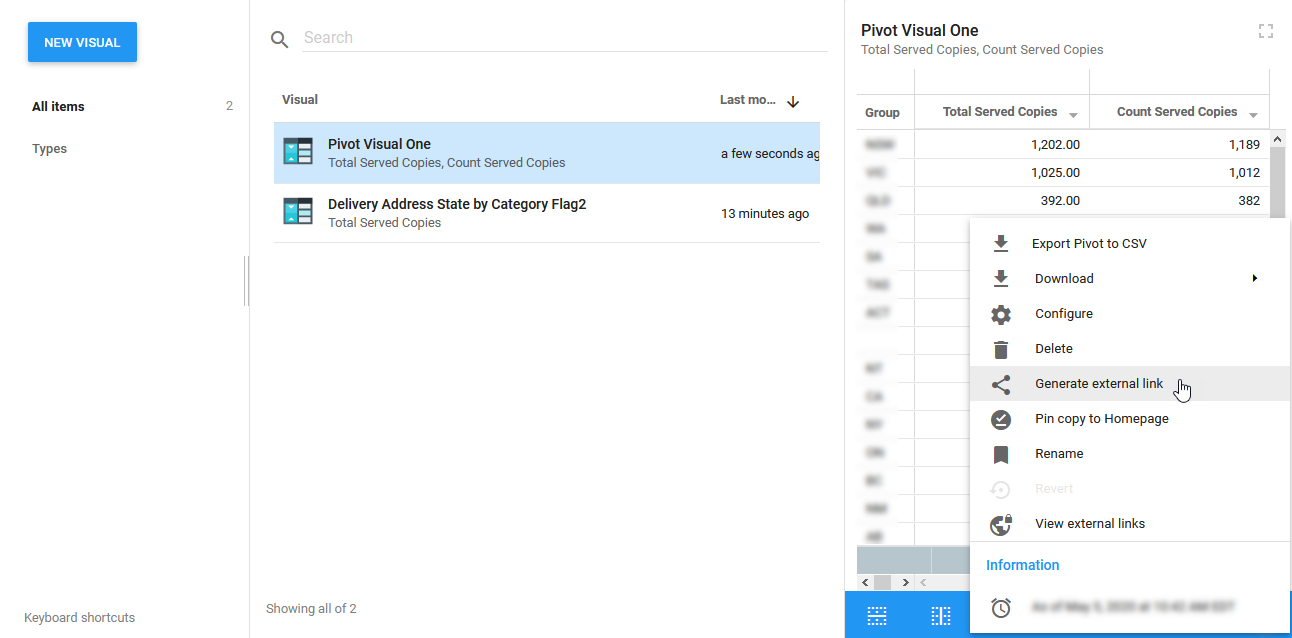
Now that you have create a visual, you will need to "Generate external link" for the visual.
From the Visuals page, select the visual you want to export by simply clicking once on the visual and then clicking on the horizontal ellipses in the bottom right and select "Generate external link"
This will bring up the following dialog:
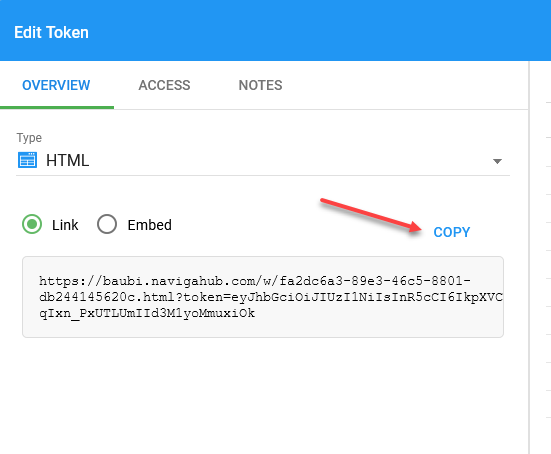
Click on Copy and store this link in notepad for later use.
Step 3
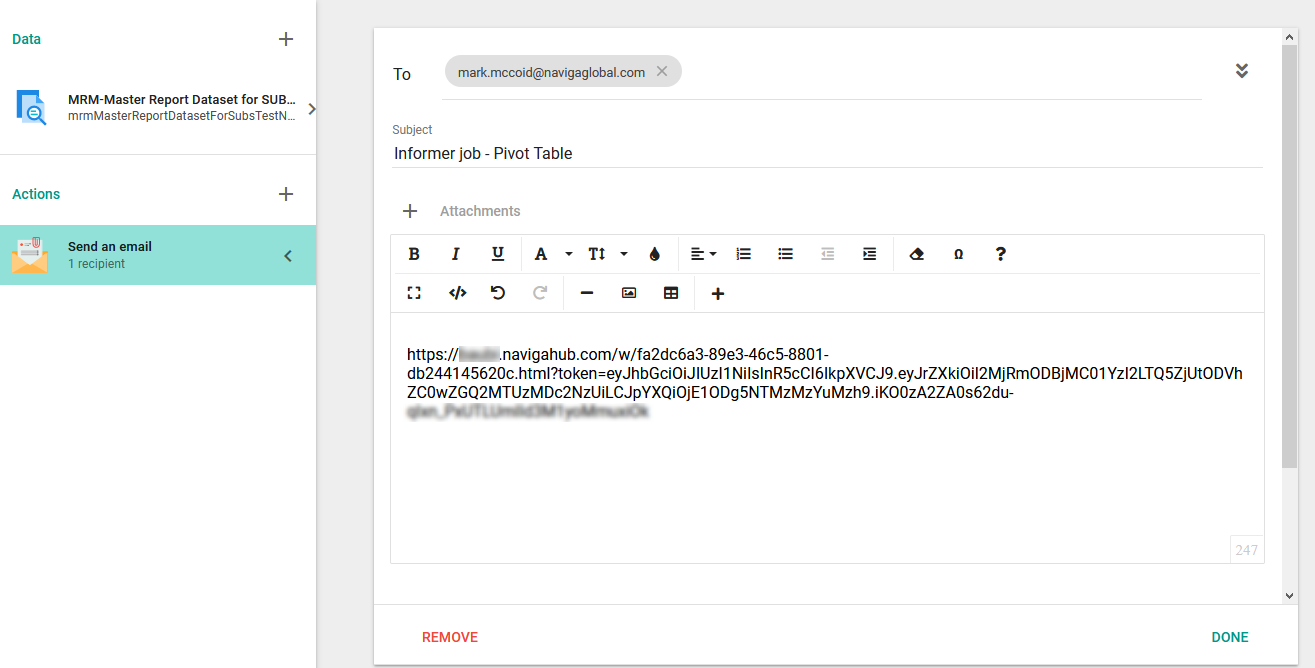
Get that link to whomever needs it. This can be done via a Job that runs everytime the dataset refreshes, or you could send it out once to the people who need it and let them know that every day around X time, there will be new data.
If you set up a job, it is as simple as putting the Dataset in a job and then setting up an email action to
Exporting To File System-FTP
When creating actions for a job, you may want to send your data to an FTP site and you will see an option "Send to FTP". However, this option does NOT work because of security restrictions.
What you can do is instead choose to "Send to file system". This option will send to an FTP site that you will have access to.
In the image below, you will see that you need to the directory where you want the file to be located. You will replace the "XXX"'s with your company's three character company code.
\\XXXprod01\repository\XXX
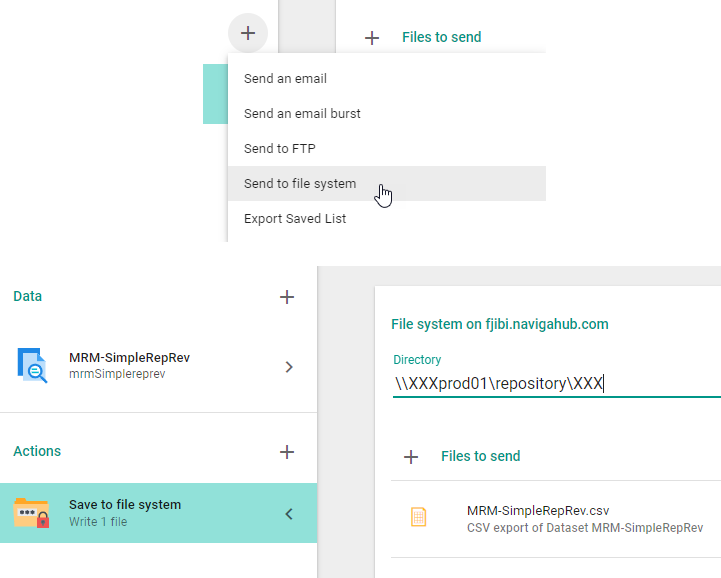
To access the FTP site where these files will be stored, you will need to use a program like Filezilla or other FTP software using the following details:
Host: ftp_useeast.navigahub.com or ftp_uswest.navigahub.com or http://ftp_euwest.navigahub.com/
Port: 22
Encryption: "Require explicit FTP over TLS"
Username/Password: Ask your support rep for this information.
Data Access Tokens
Data Access Tokens allow you to access your Dataset from a command line interface using cURL or HTTPie.
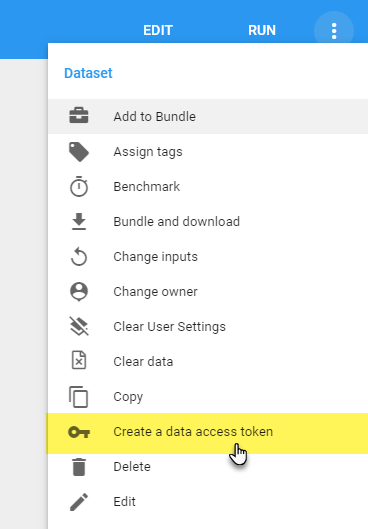
You can create a Data Access Token by clicking on the Action menu in a Dataset and choosing "Create a data access token".
You can also use the curl output to access the data via a browser or in a program that supports rest APIs.
Here is an example of using cURL with a Data Access Token:
curl "https://digital20192.msglcloud.com:8082/api/datasets/cafe1b00-9544-4799-a06a-184ebc4e4bd9/export/json?token=eyJhbGciOiJIUzI1NiIsInR5cCI6IkpXVCJ9.eyJrZXkiOiIyNTk0ZWNjNi1mYmY1LTRlZTgtYmJmNy0zOTEyNDNhMWU4NjkiLCJpYXQiOjE1ODA3NDQ3MzIuMzIzfQ.GPmK56XqmiEww_D6kSWZHh1FNSeqaadePg706u1qkEg"
If you just take what is in quotes, you can paste into a browser or into another application.
Output can be in JSON, XML or CSV.
Here is a sample of JSON output from a sample Dataset:
[
    {
        "name_id_assoc_companyName": "MERLE NORMAN COSMETICS",
        "salesrep_id_assoc_repName": [
            "Nora Smith"
        ],
        "id": "MENO*LOC1*16",
        "advName": "MERLE NORMAN COSMETICS",
        "agencyName": "",
        "brandName": "DOMESTIC",
        "baseCost": 1140
    },
    {
        "name_id_assoc_companyName": "BMW of North America, LLC",
        "salesrep_id_assoc_repName": [
            "Wayne Burrows"
        ],
        "id": "244008*A1*48",
        "advName": "BMW of North America, LLC",
        "agencyName": "Mediavest/Starcom",
        "brandName": "3 Series",
        "baseCost": 42962.7
    },
    {
        "name_id_assoc_companyName": "BIOMARIS USA",
        "salesrep_id_assoc_repName": [
            "LUCIOUS, LOLA"
        ],
        "id": "BIUS.1*LOC1*4",
        "advName": "BIOMARIS USA",
        "agencyName": "",
        "brandName": "DOMESTIC",
        "baseCost": 1908.68
    },
  ...
]
Creating a Datasource Link
If you have two mappings that are not linked, but do have a field in common, you may create your own link in Informer.
- Go to Datasources
- Select the Datasource with the mappings you want to link and double click it. If you have Prod, Test and/or Dev environments, you will need to create the link for each environment that you need it in.
- Click on the link icon (second icon from the top) at the very left panel.
- Click on "New Link" and choose how you want to link your mappings.
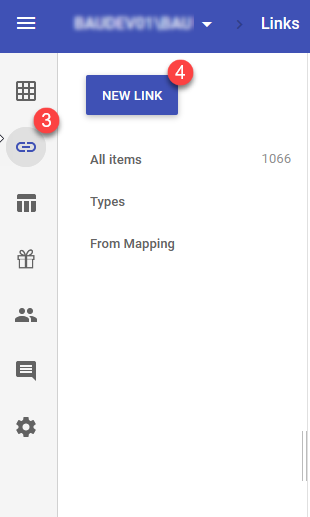
-
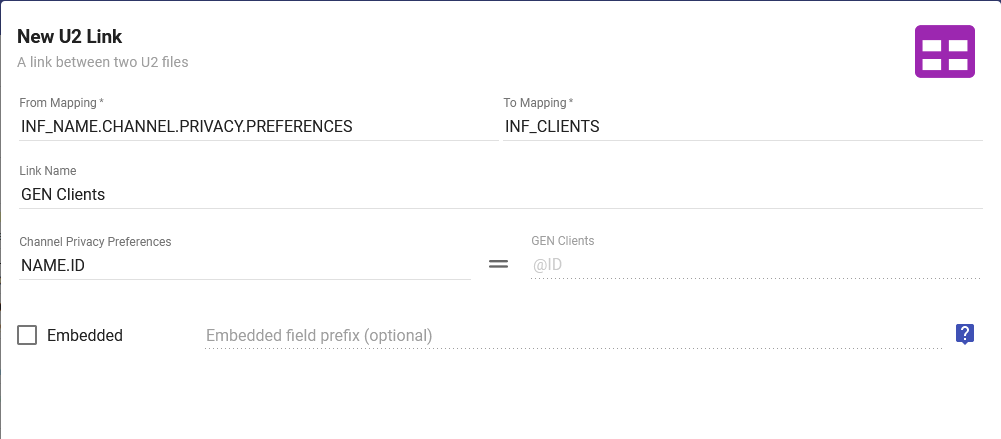
At the datasource page, click on 'New Link' and Select "U2"
-
Populate the 'From Mapping' and 'To Mapping' with the mappings you are trying to link in the system. These are the Files on the U2 side of things.
-
Provide a 'Link Name' for the link. This is how the link will appear if you try to search for it in the system and when you are navigating through your various mappings when building out a Dataset.
-
Select the field in the 'From Mapping' file that will match up with the @ID field in the 'To Mapping' file.
-
Select whether or not you wish to embed this link. If a link is embedded, all of the fields in the 'To Mapping' file will appear as though they belong to the 'From Mapping' file when you are selecting fields to add to a Dataset.
I would recommend to not embed the link unless you really need it in the main table.
-
Click 'Save'
Security in Informer
Security in Informer is based on Teams and Users.
The primary uses of the Team/User security is to be able to control which Reports and Datasets a user has access to and also what they can do with the Reports and Datasets that they have access to.
Teams and Users by themselves are not that useful. It is when we add users to teams that we start to see the power of the security system in Informer.
To start, let us look at the attributes of Teams and Users separately.
Users
Users in Informer are created by the Naviga Ad system. To make this happen, log in to the Naviga Ad system and click on the Informer tile. This will open up Informer and if it is your first time in Informer, your user will automatically be created.
As part of this automatic creation, your user will be added as a Data Wizard to the default team predefined for your site.
So what is a Data Wizard? When you add a User to a Team, you must assign them a Role on that team. The Role defines what the user can DO with the items they will have access to by being part of the team. See the Roles a User can have on a Team.
The Data Wizard role is able to do many things, so you may want to adjust this role for some users. Here are the main "power" features of a Data Wizard:
- Create their own Datasets.
- Edit any Dataset or Report owned/shared to the Team.
When a user is created, it is given the Normal User permission. This is what most users should be. The other additional attributes that you can add the the Normal User permission are:
- Job Creation - The ability to create Jobs.
- Painless Script Creation - You can ignore this option.
For system administrator users, you will change their permission from Normal User to Super User.
Super Users have full access rights to the entire system, superseding any Team-based Role assignment. A Super User can view all content within the system, including all fields within a Datasource, and can modify any Datasource, Dataset, Report, or Job.
Very few users should have Super User access.
Changing Ownership and Access to Reports
Many times you will want to change who owns and/or has access to a report. This can be done from the reports screen by selecting the Action menu to the right of a report and choosing to "Change Owner"
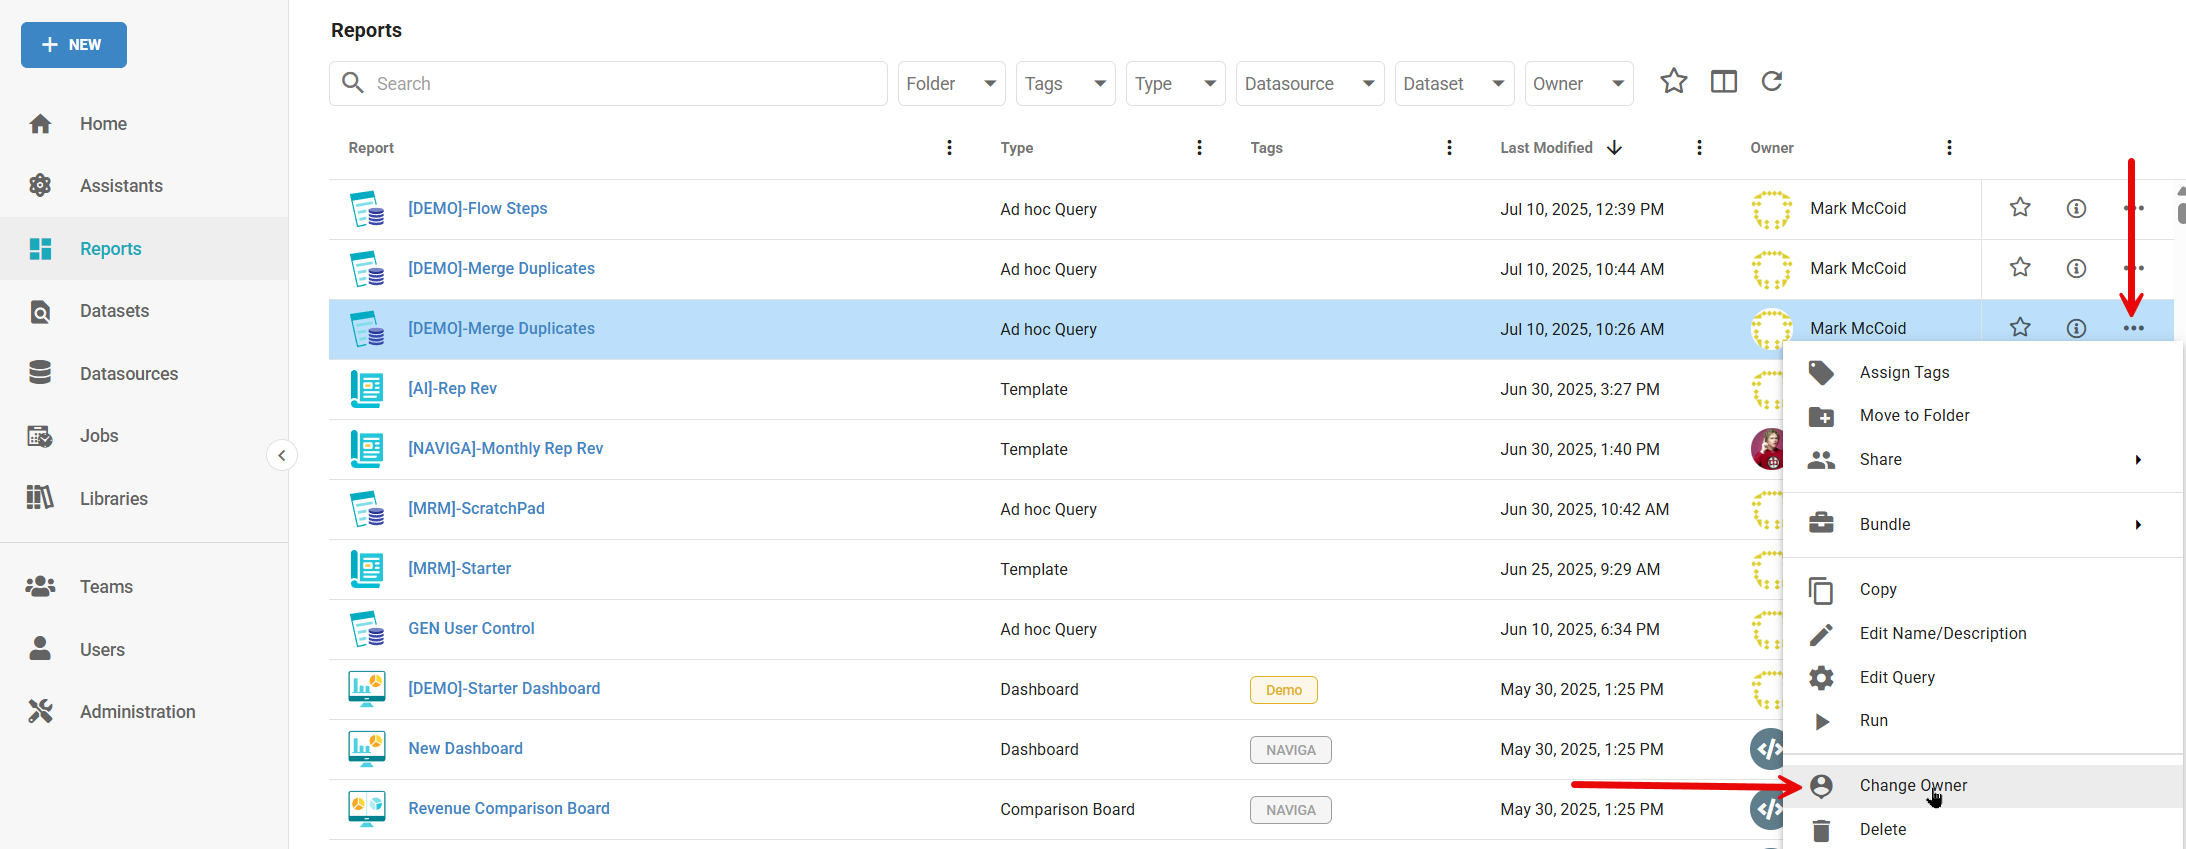
You can also do this from within a report by clicking on the Access option in the left menu and then clicking on the Owner. You will be presented with options to change the owner to a new Team or Users.
Also note that you can turn on the Share access for the report in this area also.

Disabling or Deleting a User
If a User is no longer with your company and you do not want them to access Informer anymore, you have two options. You can either Delete or Disable the user.
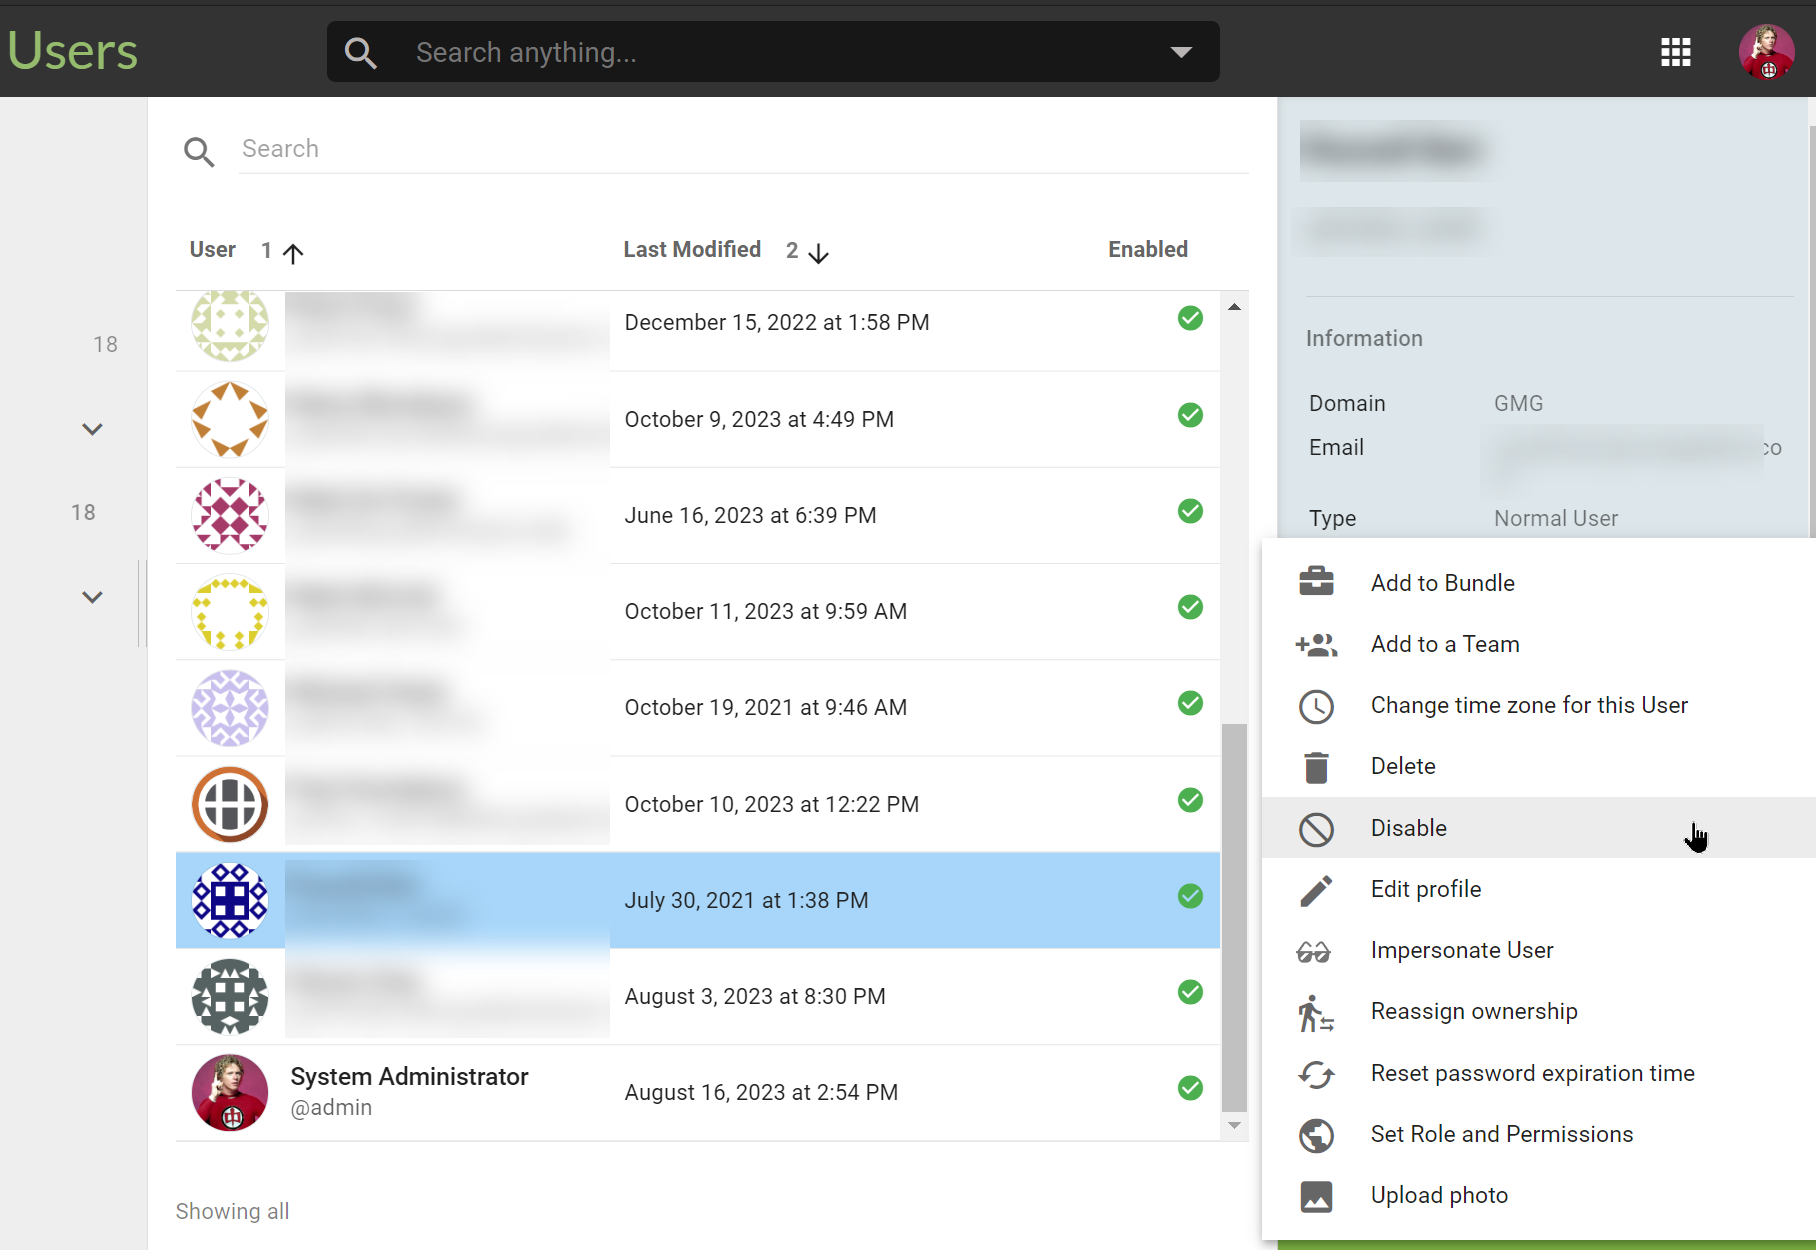
Disable a User
Since each user can own Datasets and Reports that they built, it usually makes more sense to disable the user instead of deleting them. This will give you time to review the reports the user owns before actually deleting the user.
To Disable a user, go to the Users are and select the user to disable. Then click on the Actions menu in the lower right hand corner and choose Disable User from the menu choices.
The user will no longer be able to log into Informer.
Deleting a User
To delete a user, you first must have Super User privileges. Also, you must be aware that when you delete a user, if they have any Reports or Datasets that they created, those object will need to either be moved to a new owner or they will be deleted.
Navigate to the Users area and select the User that you want to delete. In the right side panel you will see a list of the objects the user owns.
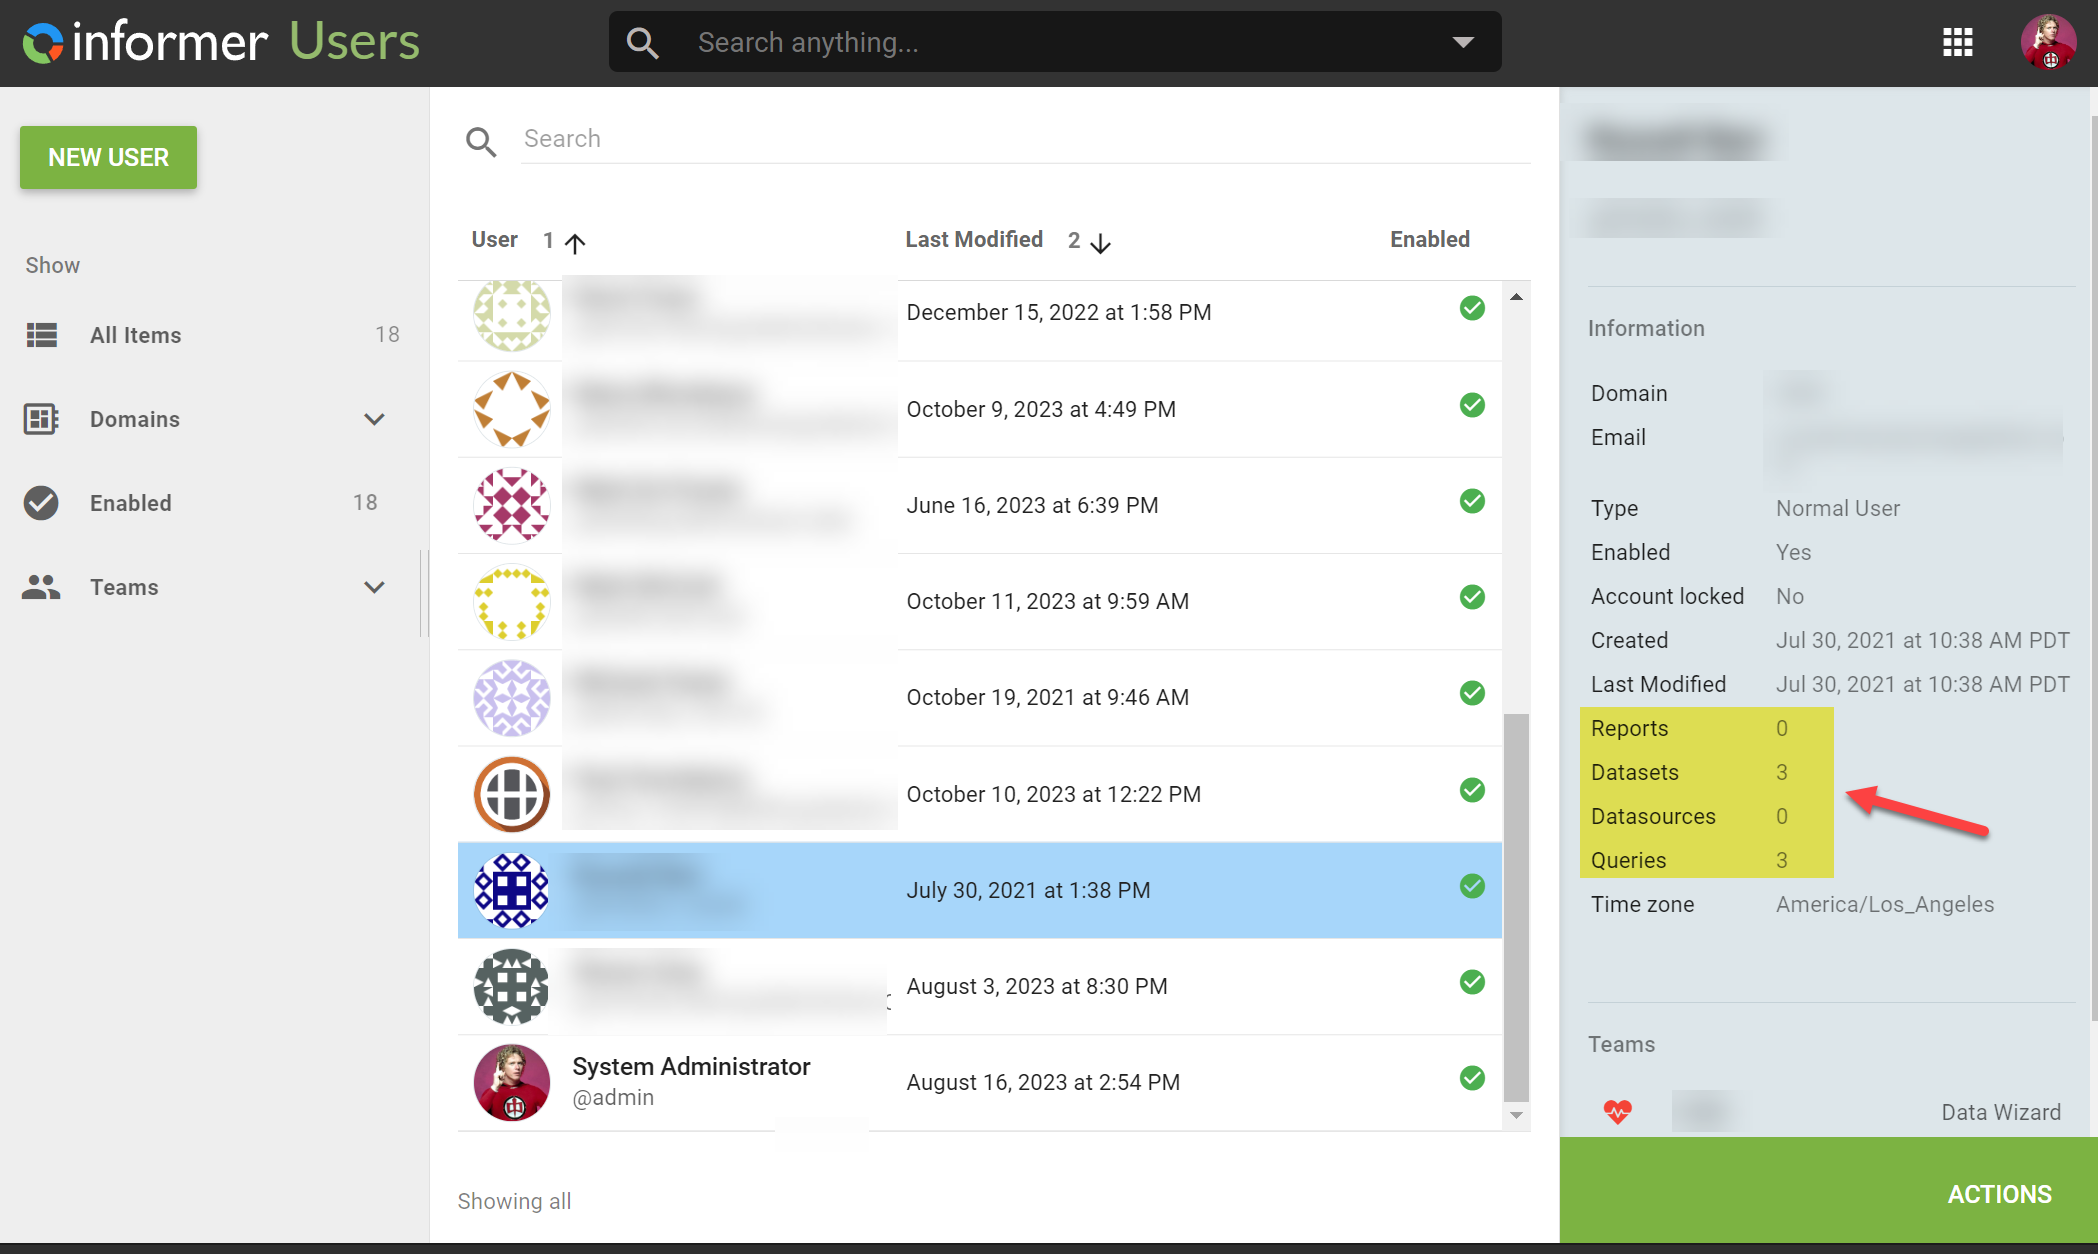
Click on the Actions link in the lower right hand corner and choose Delete
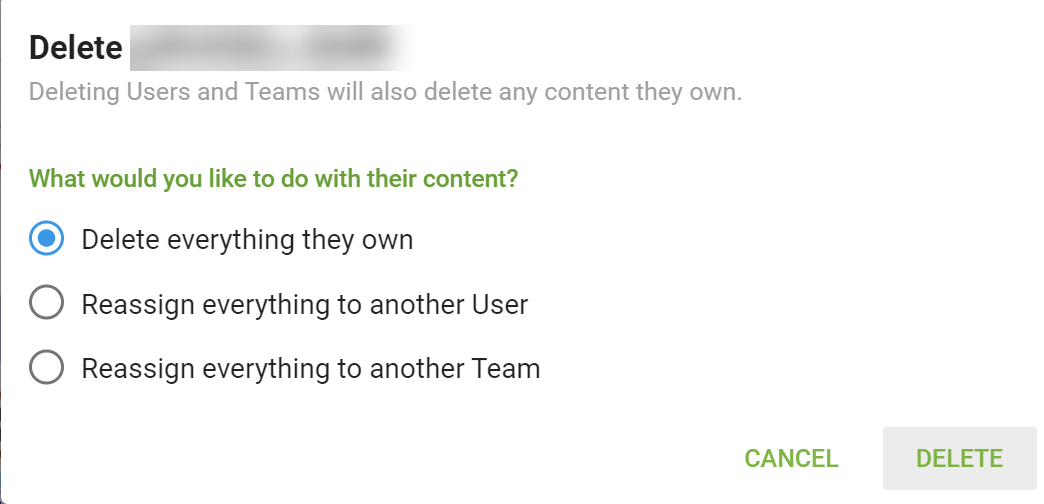
You will be given three options. Unless you are VERY sure that the objects they own are not used, DO NOT "Delete everything they own". Instead reassign to another User or Team. If you delete everything, there is no way to retrieve the objects!!
Teams
A team is simply a container for a group of users. Many sites set up teams to mimic divisions within their company.
When Informer is first set up for your site, a single team is created and all users automatically get assigned to this team with the Role of Data Wizard.
User Roles on Teams
As stated before, the flexibility in the security structure is made possible by assigning roles to users as you add them to different teams.
Here are the different roles that you can assign a user when adding them to a team.
| Role Name | Rights |
|---|---|
| Member | View anything Owned by the Team |
| Designer | All Member rights Create content from Datasets available to the Team Upload spreadsheets into new Datasets Create Reports from Datasources available to the Team Create and manage Tags |
| Data Wizard | All Designer rights Create Datasets from Datasources available to the Team Create Workspaces Edit Team-owned Datasets Promote their private Dataset filters to public. |
| Publisher | All Data Wizard rights Share Team-owned Datasets and Reports to other Teams. Generate external links to Visuals and Reports Create access tokens Create one-off Bundles of Team-owned Datasets and Reports |
| Admin | All Publisher rights Manage members Create any type of Datasource Share a Team-owned Datasource to other Teams Create one-off Bundles of Team-owned Datasources |
It is good to understand that if a resource (Dataset, report, etc) is shared with multiple teams and a user is a member of each of those teams, the most advanced user role that the user has will take precedence.
For example, if you have TeamRep and TeamAdministrator teams with a user named User_One that has the following user role assignments for each team:
- TeamRep
- User_One - Member Role
- TeamAdministrator
- User_One - Publisher Role
Consider that we have a Dataset shared with both of the above teams. When User_One goes to view that dataset, they will view it with the Publisher Role because that is the greatest role for them on that Dataset.
This is an important consideration when setting up complex security scenarios with users existing in multiple teams, giving you great flexibility, but also requiring you to spend some time fully mapping out what you want to get out of the security.
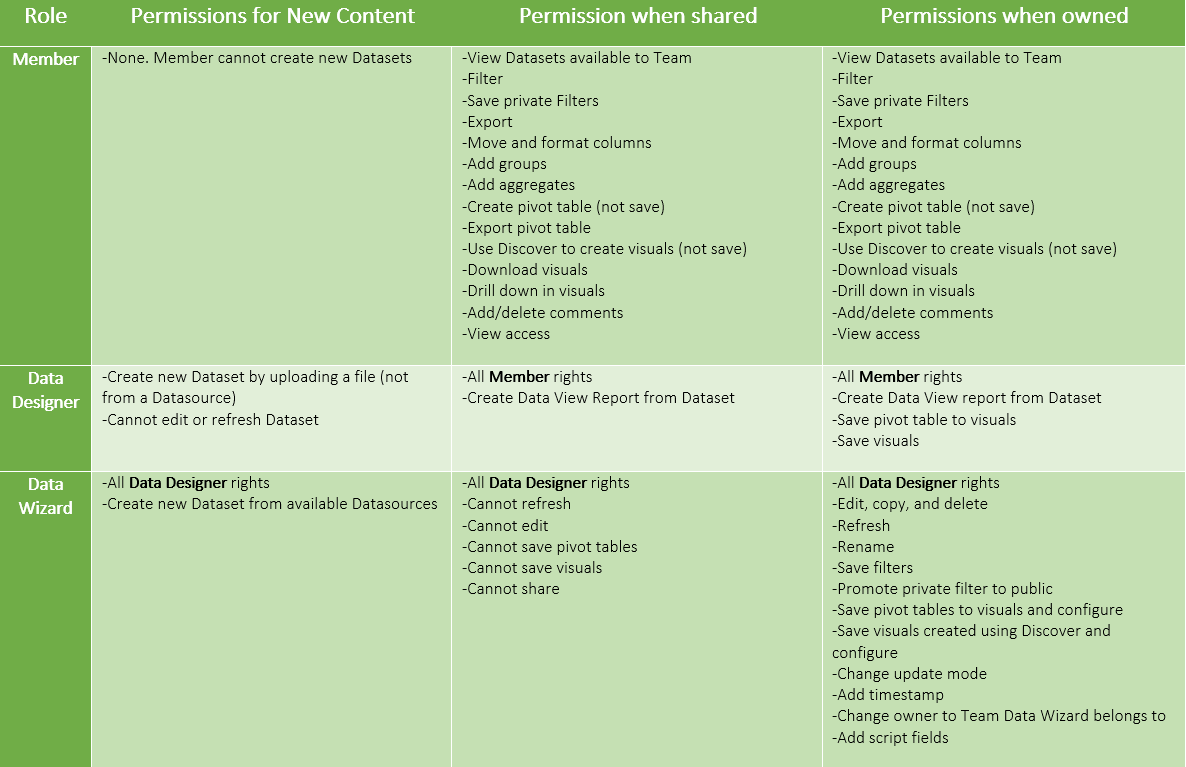
Dataset Permissions by Role

Limiting Data by Team Assignment
You can also use Team assignment to limit data in datasets.
For example, if you had two teams, Team Division 1 and Team Division 2. Each team will have users assigned to them and we want to be able to use these teams to limit data seen by users of the teams.
This is done at the level of Sharing a Dataset.
When you create a dataset, you have the options to share that dataset with teams or users. When you share the dataset, you have an additional option of being able to share it to a team, but only certain data.
The way you specify which data is through a filter.
First, you create the filters that will be used to limit the data when sharing. Here I have created two filters, one that limits data for each team that I am working with:
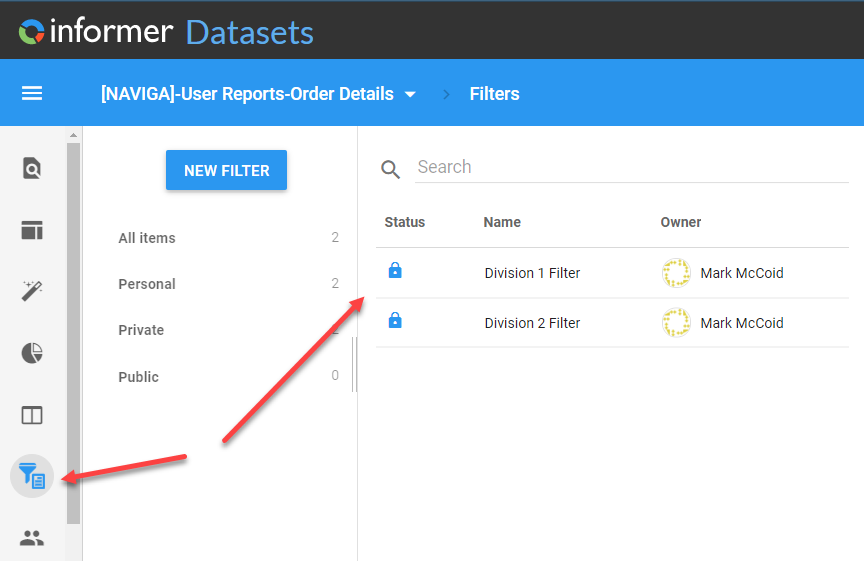
Next, you will need to Share the dataset with the appropriate teams.
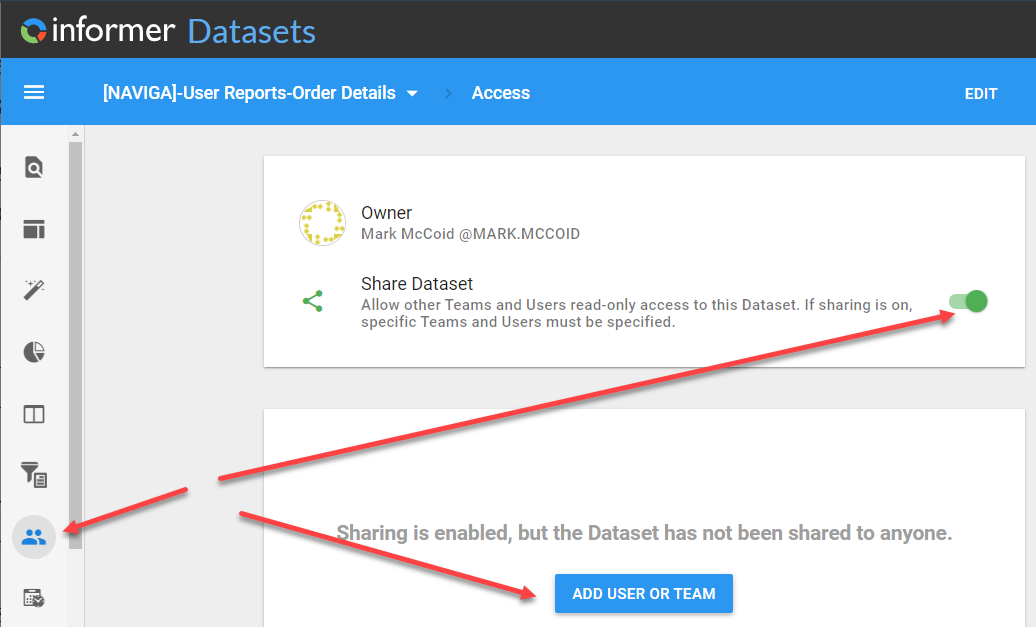
The dialog that you see when you press ADD USER OR TEAM is where the magic happens.
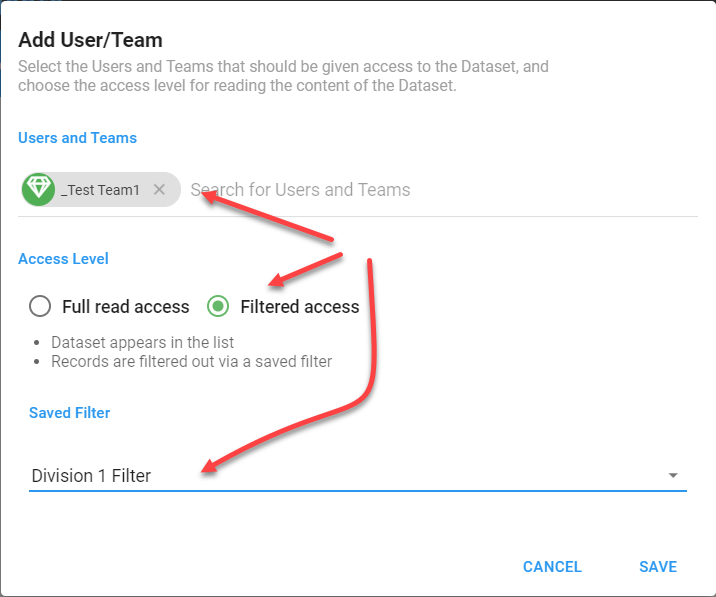
You can, and will, add multiple teams. They important part is that for each team, you select Fitered access and choose the filters that you want to be applied when any user of the team view the dataset OR a report that uses the dataset.
This becomes a very powerful tool, but again, though needs to be put into the team structure and how the filters are to be constructed to make sure the proper outcome is achieved.
Limiting Data with User Fields
User Fields can be created by Super Users in the Informer system. You can create as many as you need, but it is best to discuss with other people who might need to use them so that they can be used across different reports.
What is a User Field
User Fields are "buckets" that once created will show up for every user. Once you have created at leas on User Field you will see a User Fields section on every User:
If you did not specify a default value, the User Field will be empty initially.
To update the User Field values for each you user, you must manually go into each user and set the value that you want. In the above example, the Reps User Field is intended to hold the Rep ID or an Array of Rep IDs. Simply click the Edit Fields link and add the Rep ID(s) for the User.
How to Use
The power in User Fields comes when you use them in your Filter criteria for reports. When you create filter criteria, one of the options is User Fields
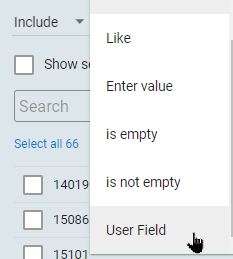
Now, when a User looks at a Dashboard or Dataset report with this filter set, the filter will look into the User Field you selected for that user and filter based on the value for that User.
For example, if I had a Reps User Field for my User, when I logged into Informer and opened the Dashboard report using that filter, it would grab the RepID in the User Field associated with my User and only return value that matched those value.
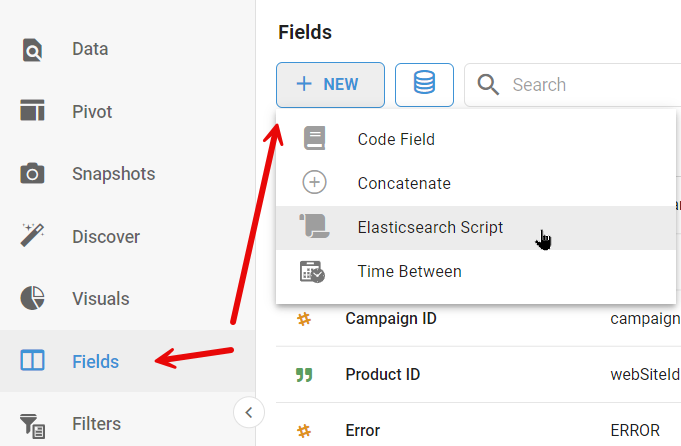
Elasticsearch Script Fields in Datasets
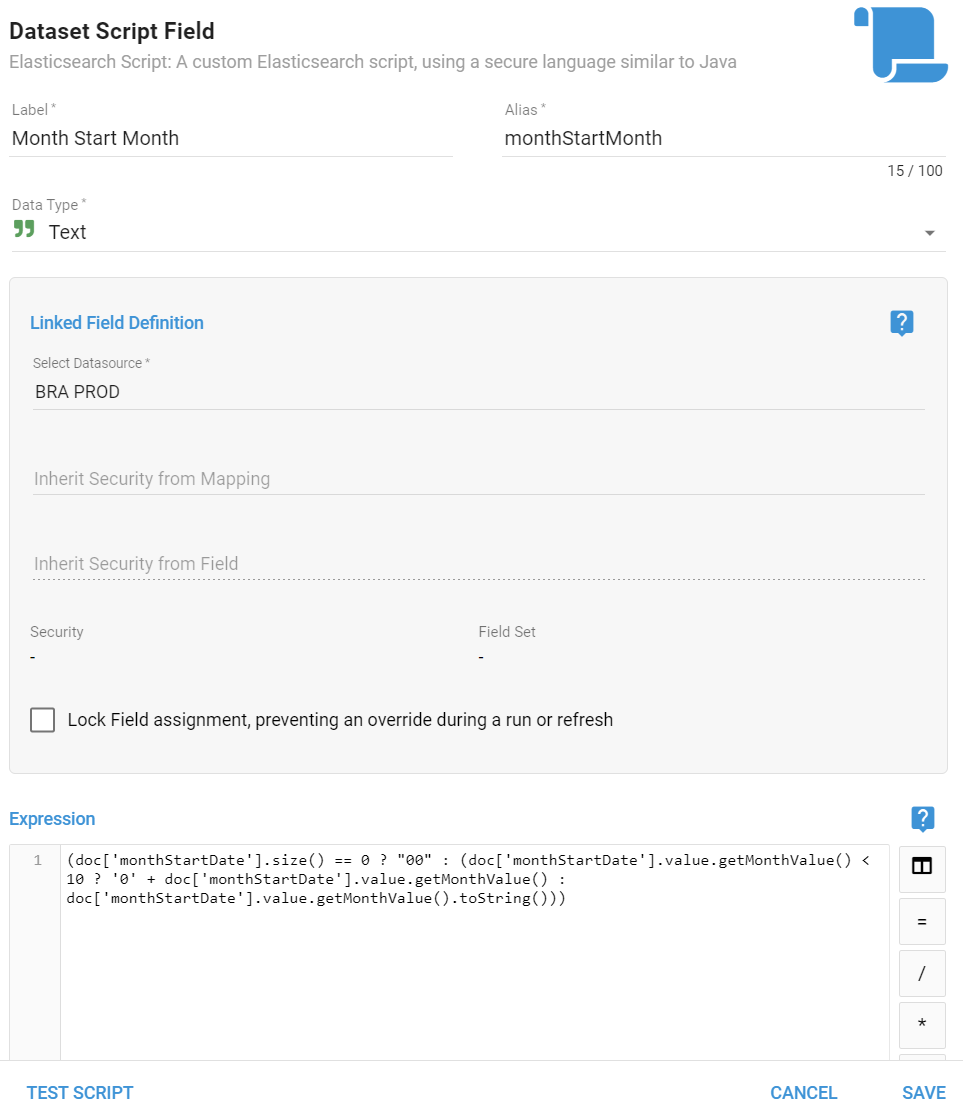
Elasticsearch Script Fields allow users to augment datasets by adding calculated fields without needing to re-index the data. A common use is for date-based operations.
This means that instead of creating the needed field in a Powerscript and reloading the dataset, we simply add the field as an Elasticsearch script.
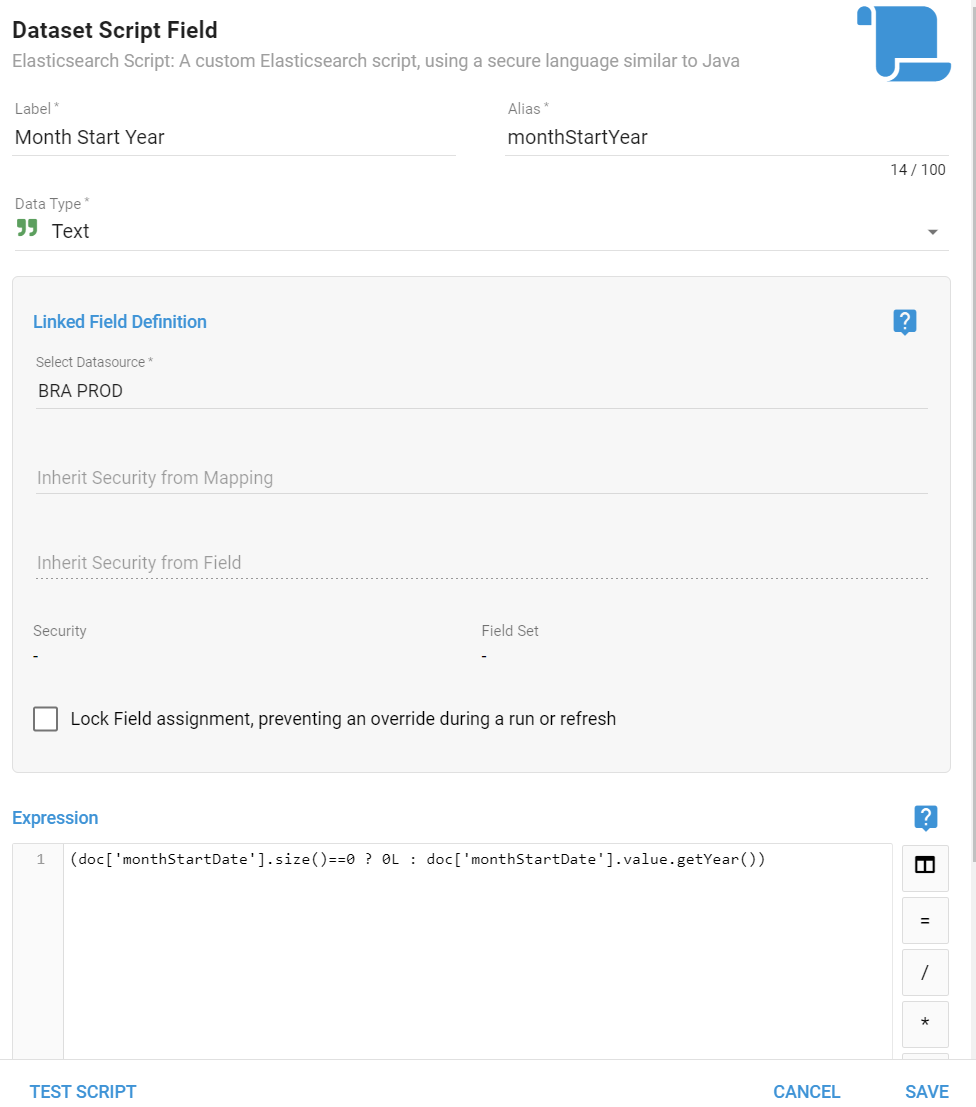
Elasticsearch Field for Year and Month
Many time we want to extract pieces of a date field to make it easier for users to filter on the data. Here are some simple Elasticsearch Scripts to extract the Year and Month from a date field.
Year
(doc['monthStartDate'].size()==0 ? 0L : doc['monthStartDate'].value.getYear())
Month with leading Zeros
(doc['monthStartDate'].size() == 0 ? "00" : (doc['monthStartDate'].value.getMonthValue() < 10 ? '0' + doc['monthStartDate'].value.getMonthValue() : doc['monthStartDate'].value.getMonthValue().toString()))
